Archive for October 2020
A HISTORY OF AGW SCIENCE
Posted on: October 31, 2020


A VERY INTERESTING HISTORICAL BIBLIOGRAPHY DETAILING THE EVOLUTION OF THE SCIENCE OF ANTHROPOGENIC GLOBAL WARMING IS FOUND ON A BLOG POST BY DR DAVID APPELL. LINK: http://www.davidappell.com/EarlyClimateScience.html . Dr. Appell’s bibliography is presented below.
THIS POST IS A CRITICAL COMMENTARY ON SELECTED CITATIONS OF THIS HISTORICAL BIBLIOGRAPHY.
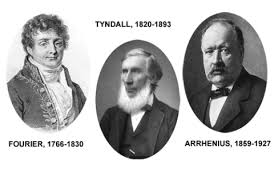
- CITATION: 1896 “On the Influence of Carbonic Acid in the Air Upon the Temperature of the Ground,“ Svante Arrhenius, Philosophical Magazine 1896(41): 237-76 (1896).. COMMENT; Although Arrhenius 1896 is often used to establish the long history and therefore the validity of AGW climate science, this work was a failed attempt to explain glaciation cycles and soon after its publication it was rejected in favor of the Milankovitch theory. In terms of time scale and dynamics not much correspondence exists between glaciation cycles and a selected centennial time scale temperature change event out of eight or more in the Holocene without the evidence that the theory can explain all of the Holocene temperature dynamics described in a related post: LINK: https://tambonthongchai.com/2019/06/11/chaoticholocene/ . The Arrhenius work does not have the assumed implication for the evaluation of AGW climate science.
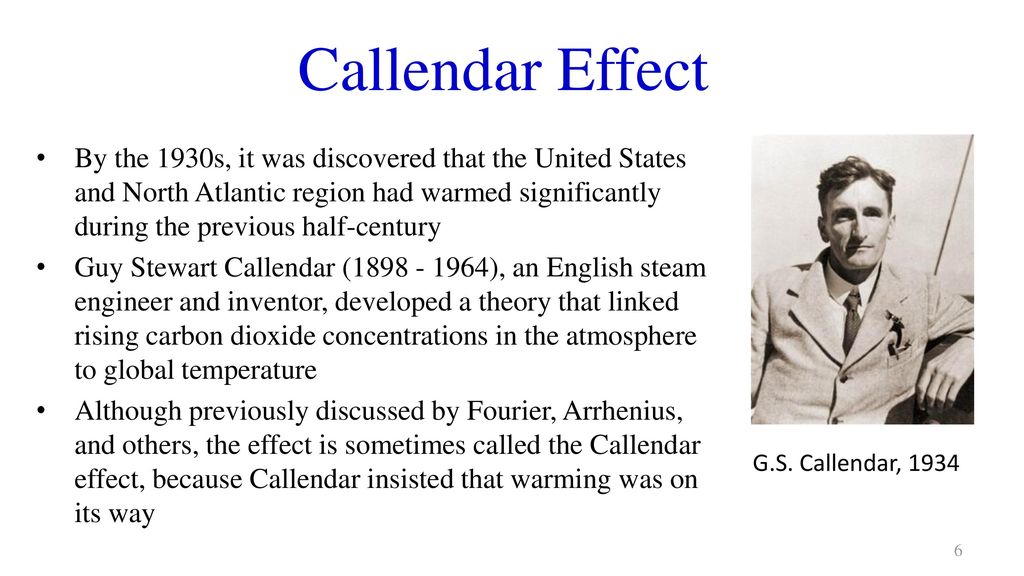
- CITATION: 1938 “The Artificial Production of Carbon Dioxide and its Influence on Temperature,” G. S. Callendar, Quarterly Journal of the Royal Meteorological Society v64 Issue 275 pp 223-240 (April 1938). [PDF]. COMMENT: The Callendar paper is an exact match with the current theory of AGW climate science. He says that fossil fuel emissions of the industrial economy since the year 1900 has caused atmospheric CO2 concentrations to rise from 1900 to 1938 and at the same time there has been a steady rise in temperature from 1900 to 1938. He concluded from this analysis that the CO2 emissions of the industrial economy from combustion of coal and other fossil fuels had caused the observed rise in atmospheric CO2 concentration and then, using a climate sensitivity of ECS=2, he was able to explain the observed rate of warming over the 38-year period in terms of rising atmospheric CO2 concentration. However, this work is completely undone in terms of the AGW climate science of our day that explains Callendar’s anthropogenic warming from 1900 to 1938 as the unresolved ETCW issue in climate science. The Early Twentieth Century Warming remains a puzzle in modern climate science because the Mauna Loa CO2 data do not validate the Callendar findings. Therefore, what was AGW climate science in 1938 is today a climate science anomaly. Details of the ETCW issue are presented in related posts on this site; LINK#1: https://tambonthongchai.com/2020/10/09/the-etcw-issue-in-climate-science/ LINK#2: https://tambonthongchai.com/2019/06/02/hegerl2018/
- The modern version of AGW climate change theory first appeared in Hansen 1988 and it is now the standard version in terms of the identification of the the reference “pre-industrial” year when AGW climate change began. In the current theory of AGW climate change, the warming began in 1950 and the rate of warming is explained in terms of the Charney climate sensitivity of ECS=3 +/- 1.5. The only variance from this pre-industrial time tag is the proposal by climate scientist Peter Cox that AGW started in “the 1970s”. There is no support for the earlier time spans found in the older papers listed here that include Callendar 1938 and Revelle 1957.
- The confusion in climate science about the start date as well as the critical rate of warming that must not be reached to avoid irreversible climate change are described in a related post on this site: LINK: https://tambonthongchai.com/2019/12/25/earth-day-wisdom/
- IN CONCLUSION: THE HISTORY OF CLIMATE SCIENCE FOUND IN THIS LIST OF CITATIONS DOES NOT PROVE OR DEMONSTRATE HOW TRUE AND CORRECT THE SCIENCE IS. IT DOES JUST THE OPPOSITE. THE CONFUSION IN SCIENCE ABOUT WHEN PRE-INDUSTRIAL WAS AND WHEN AGW BEGAN AND WHAT THE CLIMATE SENSITIVITY IS AND WHAT RATE OF WARMING IF ANY WILL CAUSE IRREVERSIBLE CLIMATE CHANGE DOES NOT PROVIDE EVIDENCE FOR A CONSENSUS SETTLED SCIENCE THAT CANNOT BE AND MUST NOT BE QUESTIONED. IT DOES JUST THE OPPOSITE.
- FOOTNOTE: Yet another source of confusion in climate science is the assumption and not the evidence that observed changes in atmospheric CO2 concentration are explained by fossil fuel emissions. We show in related posts that there is no support in the data for that proposition.
- LINK#1: https://tambonthongchai.com/2020/09/23/emission-reduction-atmospheric-co2/
- LINK#2: https://tambonthongchai.com/2020/06/10/a-monte-carlo-simulation-of-the-carbon-cycle/
- LINK#3: https://tambonthongchai.com/2018/12/19/co2responsiveness/
- LINK#4: https://tambonthongchai.com/2018/05/31/the-carbon-cycle-measurement-problem/


THE DAVID APPELL CLIMATE CHANGE CITATION LIST
1827
“On the Temperatures of the Terrestrial Sphere and Interplanetary Space,” Jean-Baptiste Joseph Fourier, Memoires de l’Academie Royale de Sciences, 7 569-604 (1827).
– English translation by William Connolley.
1856
“Circumstances affecting the Heat of the Sun’s Rays,” Eunice Foote, The American Journal of Science and Arts, November 1856, pp. XXXI.
– For more information, see “Eunice Foote’s Pioneering Research On CO2 And Climate Warming,” Raymond P. Sorenson, Search and Discovery Article #70092 (2011).
1861
“On the Absorption and radiation of Heat by Gases and Vapours, and on the Physical Connexion of Radiation, Absorption, and Conduction,” John Tyndall, Philosophical Magazine Series 4, 22, 169-194, 273-285 (1861).
“The Bakerian Lecture: On the Absorption and Radiation of Heat by Gases and Vapours, and on the Physical Connexion of Radiation, Absorption, and Conduction,” John Tyndall, Philosophical Transactions of the Royal Society of London, Vol. 151 (1861), pp. 1-36.
1863
“On radiation through the Earth’s atmosphere,” J. Tyndall, Phil. Mag. 4:200 (1863).
1896
“On the Influence of Carbonic Acid in the Air Upon the Temperature of the Ground,“ Svante Arrhenius, Philosophical Magazine 1896(41): 237-76 (1896).
1908
“The greenhouse theory and planetary temperatures,” Frank Very, Philosophical Magazine, 6, 16, 478 (1908).
1912
“Coal Consumption Affecting Climate,” Rodney and Otamatea Times, Waitemata and Kaipara Gazette, August 14, 1912. (Snopes has a good picture of the article.)
· This seems to have appeared about a month earlier in an Australian newspaper.
1927
“The Development and Present Status of the Theory of the Heat Balance in the Atmosphere” (thesis), Chaim Leib Pekeris, MIT, 1929, http://citeseerx.ist.psu.edu/viewdoc/download?doi=10.1.1.1008.1783&rep=rep1&type=pdf
1931
“The Temperature of the Lower Atmosphere of the Earth,” E.O. Hulburt, Physical Review 38, 1876-1890 (1931).
– calculated a CO2 climate sensitivity of 4°C.
1938
“The Artificial Production of Carbon Dioxide and its Influence on Temperature,” G. S. Callendar, Quarterly Journal of the Royal Meteorological Society v64 Issue 275 pp 223-240 (April 1938). [PDF]
1949
“Can Carbon Dioxide Influence Climate?” G. S. Callendar, Weather 4:310 (1949).
1953
“How Industry May Change Climate,” New York Times, May 24, 1953.
1955
“Can we survive technology?”John von Neumann, Forbes, June 1955.
from the article: “The carbon dioxide released into the atmosphere by industry’s burning of coal and oil–more than half of it during the last generation–may have changed the atmosphere’s composition sufficiently to account for a general warming of the world by about one degree Fahrenheit.”
1956
“The Influence of the 15μ Carbon-Dioxide Band on the Atmospheric Infra-red Cooling Rate,” G. N. Plass, Quarterly Journal of the Royal Meteorological Society v82 Issue 353 pp 310-324 (July 1956).
“Effect of carbon dioxide variations on climate,” G. Plass, Tellus 8:140 (1956).
“Warmer Climate on the Earth May Be Due to More Carbon Dioxide in the Air,” New York Times, Science in Review, Oct 28, 1956.
“Carbon Dioxide and the Climate,” G. N. Plass, American Scientist, vol 44 pp 302-316 (1956). [PDF]
Time magazine:
“Since the start of the industrial revolution, mankind has been burning fossil fuel (coal, oil, etc.) and adding its carbon to the atmosphere as carbon dioxide. In 50 years or so this process, says Director Roger Revelle of the Scripps Institution of Oceanography, may have a violent effect on the earth’s climate…
“Dr. Revelle has not reached the stage of warning against this catastrophe, but he and other geophysicists intend to keep watching and recording. During the International Geophysical Year (1957-58), teams of scientists will take inventory of the earth’s CO2 and observe how it shifts between air and sea. They will try to find out whether the CO2 blanket has been growing thicker, and what the effect has been. When all their data have been studied, they may be able to predict whether man’s factory chimneys and auto exhausts will eventually cause salt water to flow in the streets of New York and London.”
— “One Big Greenhouse,” Time magazine, May 28, 1956.
1957
“Carbon Dioxide Exchange Between Atmosphere and Ocean and the Question of an Increase of Atmospheric CO2 During the Past Decades,” Roger Revelle and Hans E. Suess, Tellus 9 pp 18-27 (1957).
Says the accumulation of CO2 “may become significant during future decades if industrial fuel consumption continues to rise exponentially.” The paper concludes, “Human beings are now carrying out a large-scale geophysical experiment of a kind that could not have happened in the past nor be reproduced in the future.”
1958
“Distribution of Matter in the Sea and Atmosphere: Changes in the Carbon Dioxide Content of the Atmosphere and Sea due to Fossil Fuel Combustion,” Bert Bolin and Erik Eriksson (1958). In The Atmosphere and the Sea in Motion: Scientific Contributions to the Rossby Memorial Volume (ed. B. Bolin), pp. 130-142. Rockefeller Institute Press, New York.
The video documentary “Unchained Goddess” was produced by Frank Capra for Bell Labs for their television program The Bell Telephone Hour.
“Even now, man may be unwittingly changing the world’s climate through the waste products of its civilization. Due to our releases in factories and automobiles every year of more than six billion tons of carbon dioxide, which helps the air absorb heat from the sun, our atmosphere may be getting warmer.
“Well, it’s been calculated a few degrees rise in the Earth’s temperature would melt the polar ice caps. And if this happens, an inland sea would fill a good portion of the Mississippi valley. Tourists in glass bottom boats would be viewing the drowned towers of Miami through 150 feet of tropical water. For in weather, we’re not only dealing with forces of a far greater variety than even the atomic physicist encounters, but with life itself.”
1959
Edward Teller, at a November 1959 conference on the centennial of the American oil industry at Columbia University in New York City, via The Guardian, 1/1/2018:
“Carbon dioxide has a strange property. It transmits visible light but it absorbs the infrared radiation which is emitted from the earth. Its presence in the atmosphere causes a greenhouse effect [….] It has been calculated that a temperature rise corresponding to a 10 per cent increase in carbon dioxide will be sufficient to melt the icecap and submerge New York. All the coastal cities would be covered, and since a considerable percentage of the human race lives in coastal regions, I think that this chemical contamination is more serious than most people tend to believe.”
1960
“The Concentration and Isotopic Abundances of Carbon Dioxide in the Atmosphere,” C. D. Keeling, Tellus 12 (1960) pp 200-203.
1961
“On the Radiative Equilibrium and Heat Balance of the Atmosphere,” Syukuro Manabe and Fritz Möller, Monthly Weather Review, 89, 503–532 (1961).
1963
The Conservation Foundation, Implications of Rising Carbon Dioxide Content of the Atmosphere (New York: The Conservation Foundation, 1963).
Weart, p. 44: “They issued a report suggesting that the doubling of CO2 projected for the next century could raise the world’s temperature by 4°C (more than 6°F). They warned that this could be harmful; for example, it could cause glaciers to melt and raise the sea level so that coastlines would get flooded.”
1965
A 1965 report to the Johnson Administration had a chapter on CO2’s potential to cause warming: Restoring_the_Quality_of_Our_Environment, Report of the Environmental Pollution Panel, President’s Science Advisory Committee (1965), pp. 111-133.
Frank Ikard, president of the American Petroleum Institute, speaking at API’s annual meeting in 1965:
“CO2 is being added to atmosphere by the burning of coal, oil, and natural gas at such a rate that by 2000 the heat balance will be so modified as possibly to cause marked changes in climate beyond local or national efforts.”
Source: “Early oil industry knowledge of CO2 and global warming,” Benjamin Franta, Nature Climate Change (2018).1966
“Influence of economic activity on climate,” M.I. Budyko, O.A. Drosdov and M.I. Yudin, Modern Problems of Climatology (Collection of Articles), FTD-HT-23-1338-67, Foreign Tech. Div., Wright-Patterson Air Force Base, Ohio, 484-500 (1966).
1967
“Thermal Equilibrium of the Atmosphere with a Given Distribution of Relative Humidity,” Syukuro Manabe and Richard T. Wetherald, Journal of the Atmospheric Sciences, v24 n3 (May 1967) pp 241-259. Their model found a climate sensitivity of 2.3 C.
1968
“Carbon dioxide is not toxic, but it is the chief heat-absorbing component of the atmosphere,” Donald F. Hornig said at the 1968 annual convention of the Edison Electric Institute, according to the trade group’s newsletter from that year. “Such a change in the carbon dioxide level might, therefore, produce major consequences on the climate ― possibly even triggering catastrophic effects such as have occurred from time to time in the past.”
– from the Huffington Post, 7/25/17.
1969
“The Effect of Solar Radiation Variations on the Climate of the Earth,” M. I. Budyko, Tellus vol 21 issue 5, pp. 611-619 (1969).
“A Global Climatic Model Based on the Energy Balance of the Earth-Atmosphere System,” William D. Sellers, Journal of Applied Meteorology vol. 8 pp. 392-400 (1969).
– concludes that “…man’s increasing industrial activities may eventually lead to a global climate much warmer than today.”
Daniel Patrick Moynihan, then an aide to President Nixon, warned that we needed a monitoring system of CO2 for fears of global warming:
http://www.ocregister.com/news/nixon-256138-moynihan-library.html
http://www.newser.com/story/94582/as-nixon-aide-moynihan-warned-of-climate-change-in-69.html
1970
“Is Carbon Dioxide from Fossil Fuel Changing Man’s Environment?” Charles D. Keeling, Proceedings of the American Philosophical Society, vol 114 no 1 (1970).
SCEP (Study of Critical Environmental Problems), Man’s Impact on the Global Environment. Assessment and Recommendations for Action (Cambridge, Mass.: MIT Press, 1970), p. 12.
Weart, p.70: “In their concluding conference report, as the first item in a list of potential problems, the scientists pointed to the global rise of CO2. Here too effects were beyond their power to calculate. So the study could only conclude that the risk of global warming was ‘so serious that much more must be learned about future trends of climate change.'”
1971
“Atmospheric Carbon Dioxide and Aerosols: Effects of Large Increases on Global Climate,” S. Rasool and Stephen H. Schneider, Science 173: 138-141 (1971).
Carroll L. Wilson and William H. Matthews, eds., Inadvertent Climate Modification, Report of Conference, Study of Man’s Impact on the Climate (SMIC), Stockholm (Cambridge, Mass.: MIT Press, 1971), pp. 129, v.
1972
J.S. Sawyer, “Man-made Carbon Dioxide and the “Greenhouse” Effect,” Nature 239, 23-26 (1 Sept 1972).
http://www.nature.com/nature/journal/v239/n5366/abs/239023a0.html
Abstract: “In spite of the enormous mass of the atmosphere and the very large energies involved in the weather systems which produce our climate, it is being realized that human activities are approaching a scale at which they cannot be completely ignored as possible contributors to climate and climatic change.”
Neville Nicholls, 2007:
“After summarising recent calculations of the likely impact of increasing carbon dioxide concentrations on global surface temperature, Sawyer concluded that the ‘increase of 25 per cent in carbon dioxide expected by the end of the century therefore corresponds to an increase of 0.6 degrees in world temperature — an amount somewhat greater than the climatic variations of recent centuries’…. Considering that global temperatures had, if anything, been falling in the decades leading up to the early 1970s, Sawyer’s accurate prediction of the reversal of this trend, and of the magnitude of the subsequent warming, is perhaps the most remarkable long-range forecast ever made.
“Despite claims to the contrary, our understanding of the greenhouse effect and global warming is not reliant on modern climate models and nor is it a modern preoccupation.”
http://www.theage.com.au/news/opinion/a-warning-we-ignored-35-years-go/2007/08/30/1188067274487.html
Actually, the atmospheric CO2 level increased 13% from 1972 to 2000, as measured at the Mauna Loa Observatory.
Surface temperatures increased by 0.43°C (at a linear rate of 0.015°C/year from 1972 to 2000), as measured by NASA GISS.
(Sawyer used a climate sensitivity of 1.9°C per CO2 doubling.)
1975
“Understanding Climatic Change: A Program for Action,” National Academy of Sciences (1975).
– page 43: “[changes of mean atmospheric temperature due to CO2 excess] could, however, conceivably aggregate to a further warming of about 0.5°C between now and the end of the century.” (Actual warming from January 1975 to December 2000 = 0.44 ± 0.06 °C, according to the NASA GISS dataset of monthly average global surface temperatures.)
“Climatic Change: Are We on the Brink of a Pronounced Global Warming?” Wallace S. Broecker, Science Vol. 189 no. 4201 pp. 460-463, August 8, 1975.
“The Effects of Doubling the CO2 Concentration on the Climate of a General Circulation Model,” Syukuro Manabe and Richard T. Wetherald, Journal of the Atmospheric Sciences, vol 32 no 1 pp 3-15 (1975).
“On the Carbon Dioxide-Climate Confusion,” Stephen H. Schneider, Journal of the Atmospheric Sciences, vol 32 pp 2060-2066 (November 1975).
1977
Energy and Climate: Studies in Geophysics, National Academy of Sciences, Geophysics Research Board.
Spencer Weart, AIP.org: “The panel of experts, chaired by Revelle, announced that average temperatures might climb a dangerous 6°C by the middle of the next century, possibly with a catastrophic rise of sea level. They recommended ‘a lively sense of urgency’ for studying the problem.”
“Scientists Fear Heavy Use of Coal May Bring Adverse Shift in Climate,” New York Times, July 15, 1977.
“On present-day climatic changes,” M. I. Budyko, Tellus 29 (1977) 193-204.
ABSTRACT: “The conclusion is made that present-day climate appears to have changed as a result of man’s inadvertent
impact and this change may be considerably increased in the nearest decades.
The article considers a possibility of using the numerical models of climatic theory to study future climatic changes under the conditions of increasing influence on climate of man’s economic activity.”
“Changes of Land Biota and Their Importance for the Carbon Cycle,” Bert Bolin, Science vol. 196 no. 4290 pp. 613-615 (6 May 1977).
“Can we control the carbon dioxide in the atmosphere?” F.J. Dyson, Energy 2:287–291 (1977).
1978
“Climate Modeling Through Radiative-Convective Models,” V. Ramanathan and J.A. Coakley Jr., Reviews of Geophysics and Space Physics, vol. 16 no. 4 (Nov 1978).
“Neutralization of fossil fuel CO2 by marine calcium carbonate,” W.S. Broecker and T. Takahashi, in The Fate of Fossil Fuel CO2 in the Oceans, ed. NR Andersen, A Malahoff, pp. 213–48. New York: Plenum (1978).
“What is considered the best presently available climate model for treating the Greenhouse Effect predicts that a doubling of the CO2 concentration in the atmosphere would produce a mean temperature increase of about 2 C to 3 C over most of the Earth. The model also predicts that the temperature increase near the poles may be two to three times this value.”
– memo of June 6, 1978 by Exxon scientist J.F. Black, Products Research Division, Exxon Research and Engineering Co.
1979
“Carbon Dioxide and Climate: A Scientific Assessment,” Jule G. Charney, Akio Arakawa, D. James Baker, Bert Bolin, Robert E. Dickinson, Richard M. Goody, Cecil E. Leith, Henry M. Stommel and Carl I. Wunsch (1979).
“Technical fixes for the climatic effects of CO2,” F.J. Dyson and G. Marland G, in Elliott WP, Machta L (eds), Carbon Dioxide Effects Research and Assessment Program, Workshop on the Global Effects of Carbon Dioxide from Fossil Fuels, US Department of Energy (1979).
1980
Spencer Weart, AIP.org: “In 1980, the prominent geophysicist Wallace Broecker, who had spoken out repeatedly about the dangers of climate change, vented his frustration in a letter to a Senator. Declaring that ‘the CO2 problem is the single most important and the single most complex environmental issue facing the world,’ and that ‘the clock is ticking away,’ Broecker insisted that a better research program was needed. ‘Otherwise, another decade will slip by, and we will find that we can do little better than repeat the rather wishy washy image we now have as to what our planet will be like…’
– Broecker to Sen. Paul Tsongas, 7 April 1980, “CO2 history” file, office files of Wallace Broecker, LDEO.
1981
“U.S. Study Warns of Extensive Problems from Carbon Dioxide Pollution,” Philip Shabecoff, New York Times, January 14, 1981.
1982
“CO2 Greenhouse Effect: A Technical Review,” internal Exxon document, November 12, 1982.
The cover letter says “The material has been given wide circulation to Exxon management.” The report’s projections (Figure 3) have been quite accurate; for 2020 they are spot-on.
1983
“Changing Climate: Report of the Carbon Dioxide Assessment Committee,“ National Academy of Sciences (1983).
1984
“Climate Sensitivity: Analysis of Feedback Mechanisms,” J. Hansen et al, in Climate Processes and Climate Sensitivity, AGU Geophysical Monograph 29, Maurice Ewing, Vol. 5., J.E. Hansen, and T. Takahashi, Eds. American Geophysical Union, 130-163 (1984).
1986
“Global Temperature Variations Between 1861 and 1984,” P. D. Jones, T. M. L. Wigley and P. B. Wright, Nature vol. 322, 430-434 (July 31, 1986).
1988
“Global climate changes as forecast by Goddard Institute for Space Studies three-dimensional model,” J. Hansen et al, J. Geophys. Res., 93, 9341-9364 (1988).
- for a review of the accuracy of these projections, see “Hansen’s 1988 Predictions,” Open Mind blog (March 21, 2014).
1992
“Policy Implications of Greenhouse Warming: Mitigation, Adaptation, and the Science Base,” National Academy of Sciences.
1995
“Climate Response to Increasing Levels of Greenhouse Gases and Sulphate Aerosols,” J. F. B. Mitchell et al, Nature 376, 501-504 (10 August 1995).
2005
“Earth’s Energy Imbalance: Confirmation and Implications,” James Hansen et al, Science, 28 April 2004.
2008
“The Myth of the 1970s Global Cooling Scientific Consensus,” W. Peterson et al, Bull. Amer. Meteor. Soc., 89, 1325–1337, 2008.
For the period 1965 to 1979, this article found seven articles that predicted cooling, 44 that predicted warming and 20 that were neutral.
Other
“The Discovery of Global Warming; Bibliography by Year,” Spencer Weart, aip.org
“How long ago did scientists suspect global warming might occur from greenhouse gas emissions?” CO2science.org
For reviews, see:
“The Discovery of Global Warming,” Spencer Weart, 2008.
http://books.google.com/books?isbn=067403189X
http://www.aip.org/history/climate/index.htm
“The Discovery of Global Warming: The Carbon Dioxide Greenhouse Effect,”
Spencer Weart, American Institute of Physics (Feb 2011).
http://www.aip.org/history/climate/co2.htm
Estimates of Climate Sensitivity (1896-2006), Barton Paul Levenson (2006).
The Warming Papers: The Scientific Foundation for the Climate Change Forecast, eds. David Archer and Ray Pierrehumbert, Wiley-Blackwell (Jan 2011).
http://www.wiley.com/WileyCDA/WileyTitle/productCd-1405196165.html
THIS POST IS A CRITICAL REVIEW OF A 30 OCT 2020 ONLINE ARTICLE BY RNZ EXPRESSING CONCERN ABOUT CLIMATE IMPACTS IN THE SOUTHERN PACIFIC REGION OF A DEVELOPING STRONG LA NINA LINK: https://www.rnz.co.nz/news/national/429468/marine-heatwaves-higher-tropical-cyclone-risk-what-la-nina-means-for-new-zealand-this-summer
PART-1: WHAT THE RNZ ARTICLE SAYS
Marine heatwaves, higher tropical cyclone risk: What La Niña means for New Zealand this summer. 30 October 2020. For New Zealand, La Nina means high pressure can linger to the east of the country during summer, causing more north easterly winds than usual with wet weather for the north and the east of New Zealand with the northeast wetter than usual and the southwest drier than usual. These changes imply higher frequency of storms for the north coast with a potential for more frequent storm surges and damage to coastal infrastructure. Another impact of the strong La Nina is marine heatwaves and stronger tropical cyclones that tend to occur during La Nina. Climate forecasters are expecting new temperature records to be set for New Zealand. It is implied that the marine heat waves, tropical cyclones, and temperature records have stark implications in terms of the horror of climate change.
PART-2: CRITICAL COMMENTARY
- Neither the ENSO cycle nor the observed changes in its intensity have an interpretation in terms of anthropogenic global warming as explained in a related post. LINK: https://tambonthongchai.com/2019/11/29/agw-el-nino/

2. Localized climate events such as the marine heat waves, tropical cyclones, and storm surges predicted for New Zealand must be understood as Internal Climate Variability. They have no interpretation in terms of anthropogenic global warming and they do not serve as alarming consequences of climate change that can be attenuated by taking climate action in the form of moving our energy infrastructure away from fossil fuels to renewable energy.
3. The Internal Climate Variability issue is described in a related post: LINK: https://tambonthongchai.com/2020/07/16/the-internal-variability-issue/ ABSTRACT: Internal variability in the climate system confounds assessment of human-induced climate change and imposes irreducible limits on the accuracy of climate change projections, especially at regional and decadal scales. A new collection of initial-condition large ensembles generated with seven Earth system models under historical and future radiative forcing scenarios provides new insights into uncertainties due to internal variability versus model differences. These data enhance the assessment of climate change risks, including extreme events, and offer a powerful test-bed for new methodologies aimed at separating forced signals from internal variability in the observational record. Opportunities and challenges confronting the design and dissemination of future LEs, including increased spatial resolution and model complexity alongside emerging Earth system applications, are discussed.
4. CONCLUSION: The impact of La Nina on the weather in New Zealand is an internal climate variability issue. It cannot be understood as an impact of anthropogenic global warming that can be moderated or prevented by taking climate action.

THE WIZARDS OF OZ
Posted on: October 30, 2020

IN THE YEAR 2020, AUSTRALIAN CLIMATE SCIENTISTS HAVE PREDICTED THE COLLAPSE OF OUR CIVILIZATION BY CLIMATE CHANGE IN THE YEAR 2050. THE PREDICTION IS ACCOMPANIED BY A PHOTOGRAPH OF THE MONSOON FLOOD IN DHAKA, BANGLADESH APPARENTLY AS AN INDICATOR OF THE PRECARIOUS STATE OF THE PLANET. LINK TO SOURCE: https://www.newscientist.com/article/2205741-is-it-true-climate-change-will-cause-the-end-of-civilisation-by-2050/
PART-1: WHAT THE SOURCE ARTICLE SAYS

Climate change could bring about the end of civilisation as we know it within three decades, according to a report released by the BREAKTHROUGH NATIONAL CENTRE FOR CLIMATE RESTORATION IN AUSTRALIA. The report by Breakthrough, endorsed by a retired Australian admiral, says a war-time response is needed to avoid the doomsday scenario.
The report speaks, in our opinion, a harsh but necessary truth,” says co-author David Spratt. The report presents a scenario where by 2050 more than half of the world’s population faces 20 days a year of lethal heat, crop yields globally drop by a fifth, the Amazon ecosystem collapses, the Arctic is ice-free in summer, and sea levels have risen by 0.5 metres but that is not the worst case scenario. Spratt explains that in the worst case scenario, the scale of destruction is beyond their capacity to model, with a high likelihood that human civilisation will come to an end. This is the collapse of civilization scenario of the climate change movement described by many climate change analysts including Sir David Attenborough and science historian James Burke.
The Spratt report says that more than a billion people could be displaced by climate change by 2050. Spratt cites a 2018 report by a Swedish non-profit, which cites a 2010 report by a German non-profit which said a billion people live in areas that could be inundated by sea level rise this century. The report also cites a UN website which says that in the next 30 years we may leave a billion or more vulnerable poor people with little choice but to migrate.
The Breakthrough report forecasts warming of 4C by 2100 without taking feedbacks into account and higher if we include carbon cycle feedbacks (eg warmer soil releasing more carbon). As a way of comparison, the IPCC forecasts much lower warming. The disagreement is explained by Breakthrough in terms of feedbacks that the IPCC has not taken into account and the irreversible changes they may create.

Climate scientist Mark Maslin is supportive of the Spratt report saying that the report adds to the deep concerns expressed by security experts such as the Pentagon over climate change. Maybe, just maybe, it is time for our politicians to be worried and start to act to avoid these scenarios. Climate scientist Michael Mann says the Spratt report is too extreme and counterproductive for the climate movement because that kind of talk weakens the call to climate action.

The Spratt report says that we can stop these doomsday predictions from coming to pass if we reverse emissions, which are still climbing. He cites Extinction Rebellion and says that there are plenty of signs from citizens around the world that they would like to see a war-like response to climate change. Mark Maslin is supportive because in his view a stark warning is what is needed to encourage AMBITION for climate action now being sought by the UN.

CRITICAL COMMENTARY
ISSUE#1: UNCERTAINTY: The report highlights the inconsistencies and uncertainties in climate science with respect to when and at what temperature climate change will become “irreversible” with catastrophic consequences and exactly how catastrophic those catastrophic consequences will be. In objective scientific inquiry these uncertainties would imply that the uncertainties are too large and that therefore the research findings have low information content – in other words that they don’t really know. However, as explained in a related post, uncertainty has a very different and a very flawed interpretation in climate science: LINK: https://tambonthongchai.com/2020/04/22/climate-science-uncertainty/ where only the most extreme worst case end of the uncertainty band is taken as the information contained in that uncertainty band. In objective scientific inquiry untainted by advocacy or activism needs, uncertainty has a very different interpretation and that is that we don’t know. Climate scientists, including Maslin and Mann, subscribe to the odd and flawed climate science theory that the less they know the scarier climate change gets LINK: https://tambonthongchai.com/2018/05/22/global-warming-science-2007-the-dearth-of-scientific-knowledge-only-adds-to-the-alarm/
ISSUE#2: ACTIVISM/ADVOCACY: The comment by Michael Mann is that the extreme assessments in the Spratt report are a bad thing not because they are not the best objective and unbiased assessment but because they may cause people to give up hope and thereby make it harder for climate science to sell their climate action agenda of moving the world’s energy infrastructure away from fossil fuels to renewables. At the same time we find that in the language of the Spratt report and its support from Mark Maslin, the most extreme possible assessment of climate change survives in any discussion of uncertainty in a language of what COULD happen given the uncertainty of the estimate and the “unknowns” such as feedbacks. As in the case of Mann, it is climate action advocacy and its needed biases and not unbiased objective scientific inquiry that determines how these difficult uncertainties and information vacuums are resolved. This odd and unscientific methodology in climate science is discussed in two related posts on this site:
LINK#1: https://tambonthongchai.com/2019/02/03/hidden-hand/ : LINK#2: https://tambonthongchai.com/2018/08/03/confirmationbias/

CONCLUSION: We conclude from the analysis presented above that the collapse of civilization forecast in the Spratt report for 2050, 30 years from now, is not credible because it is not a product of unbiased and objective scientific inquiry but a product of bias in research methodology driven by the activism and advocacy needs and the corresponding biases of the researchers that carried out the investigation and came to these horrific conclusions.


THIS POST IS A RESPONSE TO A SCIENCE-ALERT ARTICLE OF OCTOBER 2020 THAT CLIMATE CHANGE IS CHANGING THE SHAPE OF GREENLAND’S COASTLINE WITH THE IMPLICATION THAT THESE CHANGES CAN AND MUST BE STOPPED BY TAKING CLIMATE ACTION. LINK TO SCIENCE-ALERT ARTICLE: https://www.sciencealert.com/melting-ice-is-changing-greenland-s-coast-impacting-on-its-marine-ecosystems
And from the Centre for International Governance Innovation we have this: If We Protect the Arctic, We Save the Planet. October 3, 2019:
LINK: https://www.cigionline.org/articles/if-we-protect-arctic-we-save-planet

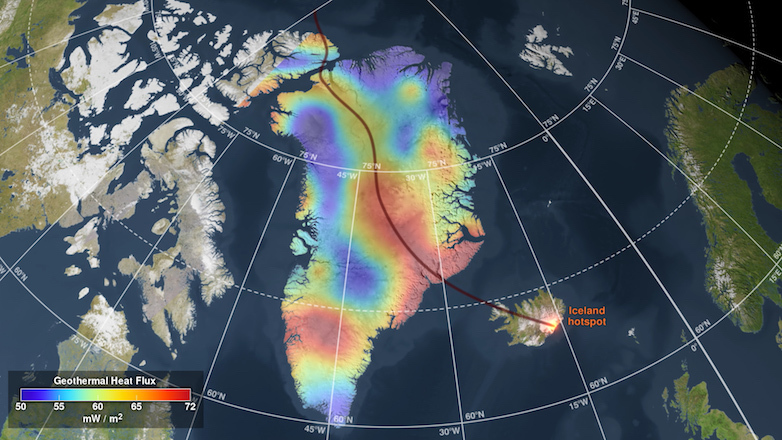
HERE WE PRESENT THE CASE THAT THE REGION IN QUESTION IS GEOLOGICALLY ACTIVE WITH MAGMATIC AND VOLCANIC ACTIVITY ALONG THE JAN MAYEN TREND AND THE GREENLAND-ICELAND MANTLE PLUME AND THAT THEREFORE A PURELY ATMOSPHERIC INTERPRETATION OF ICE MELT EVENTS IN THIS REGION IS NOT POSSIBLE WITHOUT SIGNIFICANT AND UNBIASED EVIDENCE OF SUCH CAUSATION.

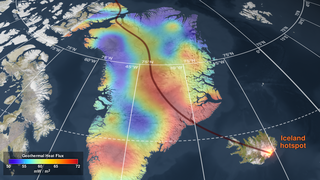
The relevant geological features of the Arctic are described in a related post: LINK: https://tambonthongchai.com/2019/07/01/arctic/ . It is noted that there is significant geological activity in the form of volcanism and mantle flows around and under Iceland and Greenland that derive from the Mid Arctic Rift, the Greenland-Iceland mantle plume and the Baffin Bay-Labrador rift system. Geothermal heat flux from these seafloor activities play an important role in Greenland ice sheet and sea ice dynamics in the Arctic and therefore these phenomena cannot be understood purely in terms of atmospheric forcing implied by anthropogenic global warming. This is why sea ice melt dynamics do not correspond with global warming temperature as shown in related posts on this site. LINK: https://tambonthongchai.com/2020/09/25/list-of-arctic-sea-ice-posts/ .

The bibliography below provides additional support for this thesis. The role of anthropogenic global warming in these events can only be understood in the context of these geothermal heat fluxes. More importantly, the role of anthropogenic global warming in these ice melt dynamics derived exclusively from an atmosphere bias is not credible.

The science alert presentation on the exclusive role of anthropogenic global warming in coastal ice melt phenomena in Greenland is therefore also not credible. Analyses of this nature are likely derived from advocacy and they must therefore be understood more in terms of confirmation bias than objective scientific inquiry. LINK: https://tambonthongchai.com/2018/08/03/confirmationbias/
THE RELEVANT BIBLIOGRAPHY
- Rysgaard, Søren, et al. “High geothermal heat flux in close proximity to the Northeast Greenland Ice Stream.” Scientific reports 8.1 (2018): 1-8. The Greenland ice sheet (GIS) is losing mass at an increasing rate due to surface melt and flow acceleration in outlet glaciers. Currently, there is a large disagreement between observed and simulated ice flow, which may arise from inaccurate parameterization of basal motion, subglacial hydrology or geothermal heat sources. Recently it was suggested that there may be a hidden heat source beneath GIS caused by a higher than expected geothermal heat flux (GHF) from the Earth’s interior. Here we present the first direct measurements of GHF from beneath a deep fjord basin in Northeast Greenland. Temperature and salinity time series (2005–2015) in the deep stagnant basin water are used to quantify a GHF of 93 ± 21 mW m−2 which confirm previous indirect estimated values below GIS. A compilation of heat flux recordings from Greenland show the existence of geothermal heat sources beneath GIS and could explain high glacial ice speed areas such as the Northeast Greenland ice stream. LINK TO FULL TEXT: https://www.nature.com/articles/s41598-018-19244-x?fbclid=IwAR2i5VghxAuDlzyvIpeWDOKbth1dMfB5ERMSvhqrS9XDGFYOnJ4bQzD7eAM
- van der Veen, Cornelis J., et al. “Subglacial topography and geothermal heat flux: Potential interactions with drainage of the Greenland ice sheet.” Geophysical research letters 34.12 (2007). Many of the outlet glaciers in Greenland overlie deep and narrow trenches cut into the bedrock. It is well known that pronounced topography intensifies the geothermal heat flux in deep valleys and attenuates this flux on mountains. Here we investigate the magnitude of this effect for two subglacial trenches in Greenland. Heat flux variations are estimated for idealized geometries using solutions for plane slopes derived by Lachenbruch (1968). It is found that for channels such as the one under Jakobshavn Isbræ, topographic effects may increase the local geothermal heat flux by as much as 100%. LINK TO FULL TEXT: https://agupubs.onlinelibrary.wiley.com/doi/full/10.1029/2007GL030046
- Alley, R. B., et al. “Possible role for tectonics in the evolving stability of the Greenland Ice Sheet.” Journal of Geophysical Research: Earth Surface 124.1 (2019): 97-115. The history of the Greenland Ice Sheet has been influenced by the geodynamic response to ice sheet fluctuations, and this interaction may help explain past deglaciations under modest climate forcing. We hypothesize that when the Iceland hot spot passed beneath north‐central Greenland, it thinned the lithosphere and left anomalous heat likely with partially melted rock; however, it did not break through the crust to supply voluminous flood basalts. Subsequent Plio‐Pleistocene glacial‐interglacial cycles caused large and rapidly migrating stresses, driving dike formation and other processes that shifted melted rock toward the surface. The resulting increase in surface geothermal flux favored a thinner, faster‐responding ice sheet that was more prone to deglaciation. If this hypothesis of control through changes in geothermal flux is correct, then the long‐term (105 to 106 years) trend now is toward lower geothermal flux, but with higher‐frequency (≤104 to 105 years) oscillations linked to glacial‐interglacial cycles. Whether the geothermal flux is increasing or decreasing now is not known but is of societal relevance due to its possible impact on ice flow. We infer that projections of the future of the ice sheet and its effect on sea level must integrate geologic and geophysical data as well as glaciological, atmospheric, oceanic, and paleoclimatic information.
- Greve, Ralf. “Geothermal heat flux distribution for the Greenland ice sheet, derived by combining a global representation and information from deep ice cores.” Polar Data Journal 3 (2019): 22-36. We present a distribution of the geothermal heat flux (GHF) for Greenland, which is an update of two earlier versions by Greve (2005, Ann. Glaciol. 42) and Greve and Herzfeld (2013, Ann. Glaciol. 54). The GHF distribution is constructed in two steps. First, the global representation by Pollack et al. (1993, Rev. Geophys. 31) is scaled for the area of Greenland. Second, by means of a paleoclimatic simulation carried out with the ice sheet model SICOPOLIS, the GHF values for five deep ice core locations are modified such that observed and simulated basal temperatures match closely. The resulting GHF distribution generally features low values in the south and the north-west, whereas elevated values prevail in central North Greenland and towards the north-east. The data are provided as NetCDF files on two different grids (EPSG:3413 grid, Bamber grid) that have frequently been used in modelling studies of the Greenland ice sheet, and for the three different resolutions of 5 km, 10 km and 20 km.
- Smith-Johnsen, Silje, Basile de Fleurian, and Kerim H. Nisancioglu. “The role of subglacial hydrology in ice streams with elevated geothermal heat flux.” Journal of Glaciology 66.256 (2020): 303-312. The spatial distribution of geothermal heat flux (GHF) under ice sheets is largely unknown. Nonetheless, it is an important boundary condition in ice-sheet models, and suggested to control part of the complex surface velocity patterns observed in some regions. Here we investigate the effect of including subglacial hydrology when modelling ice streams with elevated GHF. We use an idealised ice stream geometry and a thermomechanical ice flow model coupled to subglacial hydrology in the Ice Sheet System Model (ISSM). Our results show that the dynamic response of the ice stream to elevated GHF is greatly enhanced when including the interactive subglacial hydrology. On the other hand, the impact of GHF on ice temperature is reduced when subglacial hydrology is included. In conclusion, the sensitivity of ice stream dynamics to GHF is likely to be underestimated in studies neglecting subglacial hydrology.
- Mordret, Aurélien. “Uncovering the Iceland hot spot track beneath Greenland.” Journal of Geophysical Research: Solid Earth 123.6 (2018): 4922-4941. During the past 120 Ma, the Greenland craton drifted over the Iceland hot spot; however, uncertainties in geodynamic modeling and a lack of geophysical evidence prevent an accurate reconstruction of the hot spot track. I image the Greenland lithosphere down to 200‐km depth with both group and phase velocity seismic noise tomography. The 3‐D shear wave velocity model obtained using 4–5 years of continuous seismic records from the Greenland Ice Sheet Monitoring Network is well resolved for most of the Greenland main island. The crustal part of the model clearly shows different tectonic units. The hot spot track is observed as a linear high‐velocity anomaly in the middle and lower crust associated with magmatic intrusions. In the upper mantle, a pronounced low‐velocity anomaly below the east coast might be due to the remnant effect of the Iceland hot spot when it was at its maximum intensity. Thermomechanical modeling suggests that this area has higher temperature and lower viscosity than the surrounding cratonic areas and experiences a higher than average surface heat flow. This new detailed picture of the Greenland lithosphere will drive more accurate geodynamic reconstructions of tectonic plate motions and help to better understand the North Atlantic tectonic history. Models of Greenland glacial isostatic adjustment will benefit from the 3‐D upper‐mantle viscosity model, which in turn will enable more precise estimations of the Greenland ice sheet mass balance. Plain Language Summary: The ice sheet covering most of Greenland prevents scientists to know the geology and composition of the crust and therefore prevents them to understand the history of Greenland. Seismic tomography can be used to make images of the internal structure of the Earth below the ice and down to several hundreds of kilometers depth. Generally, seismologists use the waves generated by earthquakes to scan the Earth, but Greenland lacks of a sustained seismicity. Here I used the tiny ambient vibrations coming from the interactions between the oceanic waves and the continent, recorded during several years, to overcome this difficulty and reveal the internal structure of the Greenland lithosphere. I show that Greenland crust is made of several tectonic units separated by a track of volcanic intrusions left behind by the Iceland hot spot when it was below Greenland, about 60 Ma ago. The hot spot also lets a distinctive temperature anomaly in the upper mantle that still influences nowadays the dynamics of the whole continent and the ice sheet on top of it.
- Nielsen, Thomas K., Hans Christian Larsen, and John R. Hopper. “Contrasting rifted margin styles south of Greenland: implications for mantle plume dynamics.” Earth and Planetary Science Letters 200.3-4 (2002): 271-286. We present new and reprocessed seismic reflection data from the area where the southeast and southwest Greenland margins intersected to form a triple junction south of Greenland in the early Tertiary. During breakup at 56 Ma, thick igneous crust was accreted along the entire 1300-km-long southeast Greenland margin from the Greenland Iceland Ridge to, and possibly ∼100 km beyond, the triple junction into the Labrador Sea. However, highly extended and thin crust 250 km to the west of the triple junction suggests that magmatically starved crustal formation occurred on the southwest Greenland margin at the same time. Thus, a transition from a volcanic to a non-volcanic margin over only 100–200 km is observed. Magmatism related to the impact of the Iceland plume below the North Atlantic around 61 Ma is known from central-west and southeast Greenland. The new seismic data also suggest the presence of a small volcanic plateau of similar age close to the triple junction. The extent of initial plume-related volcanism inferred from these observations is explained by a model of lateral flow of plume material that is guided by relief at the base of the lithosphere. Plume mantle is channelled to great distances provided that significant melting does not take place. Melting causes cooling and dehydration of the plume mantle. The associated viscosity increase acts against lateral flow and restricts plume material to its point of entry into an actively spreading rift. We further suggest that thick Archaean lithosphere blocked direct flow of plume material into the magma-starved southwest Greenland margin while the plume was free to flow into the central west and east Greenland margins. The model is consistent with a plume layer that is only moderately hotter, ∼100–200°C, than ambient mantle temperature, and has a thickness comparable to lithospheric thickness variations, ∼50–100 km. Lithospheric architecture, the timing of continental rifting and viscosity changes due to melting of the plume material are therefore critical parameters for understanding the distribution of magmatism.
- Steinberger, Bernhard, et al. “Widespread volcanism in the Greenland–North Atlantic region explained by the Iceland plume.” Nature Geoscience 12.1 (2019): 61-68. In the classical concept, a hotspot track is a line of volcanics formed as a plate moves over a stationary mantle plume. Defying this concept, intraplate volcanism in Greenland and the North Atlantic region occurred simultaneously over a wide area, particularly around 60 million years ago, showing no resemblance to a hotspot track. Here, we show that most of this volcanism can nonetheless be explained solely by the Iceland plume interacting with seafloor spreading ridges, global mantle flow and a lithosphere (the outermost rigid layer of the Earth) with strongly variable thickness. An east–west corridor of thinned lithosphere across central Greenland, as inferred from new, highly resolved tomographic images, could have formed as Greenland moved westward over the Iceland plume between 90 and 60 million years ago. Our numerical geodynamic model demonstrates how plume material may have accumulated in this corridor and in areas east and west of Greenland. Simultaneous plume-related volcanic activities starting about 62 million years ago on either side of Greenland could occur where and when the lithosphere was thin enough due to continental rifting and seafloor spreading, possibly long after the plume reached the base of the lithosphere.
FIRE BELOW. ICE ABOVE. (NASA) LINK: https://climate.nasa.gov/news/2844/fire-below-ice-above-volcanoes-glaciers-and-sea-level-rise/
By Pat Brennan, NASA’s Sea Level Change Portal.
The movement of continents is far slower than a snail’s pace. It’s more like watching your fingernails grow. But speed up the movie over tens of millions of years and it begins to look like a demolition derby. Riding over Earth’s mantle on strong but flexible plates, the continents smash together and tear themselves apart, creating rugged mountain chains or deep ocean trenches. Hot magma from below the crust can rise toward the surface, like a blister pushing up below the skin. These gas and liquid-rich rocks create volcanoes. And they are created by hot spots – buoyant material that rises from more than 400 miles (660 kilometers) down, or even as deep as the core-mantle boundary. The ocean crust and continental plates glide over these hot spots through time, leaving scars over millions of years that reveal the plates’ paths. New seismic data and analysis, along with mechanical modeling capabilities, are allowing scientists to get to know these previously cryptic features a little better. And they are turning out to be potentially important when it comes to predicting how quickly the glaciers of Greenland and Antarctica will flow into the sea, reducing ice mass in the polar regions and raising sea levels. The heat welling up from Earth’s interior beneath ice sheets and glaciers has nothing to do with the relatively rapid change in climate over recent decades, driven mainly by human emissions of greenhouse gases that warm the atmosphere. Heat sources from the deep Earth can remain steady for 50, 90 or 100 million years; human-driven climate change is occurring over mere decades and centuries. Easing glacial speed limits. But as the coastal ice shelves that hold back glaciers begin to thin and melt away, the glaciers – essentially rivers of ice – are suddenly free to flow more quickly. If their channels happen to carry them over hot spots in the mantle, they can flow all the faster. “Heat content within an ice sheet raises the temperature, and therefore lowers viscosity” of the ice at the base of the glacier, said Erik Ivins, a senior research scientist at NASA’s Jet Propulsion Laboratory in Pasadena, California. The result: lubrication of the glacier’s movement. “It’s capable of expelling ice mass through faster flow,” Ivins said. A dramatic example is found in Greenland, where a long “thermal track” was recently revealed beneath the miles-thick ice sheet that covers the giant island. This scar tells an 80-million-year story. As the North American continental plate carried Greenland north, it glided over a relatively stationary hot spot – the same spot that later formed Iceland after Greenland had moved on, leaving the hot spot to punch out a new land mass from the crust beneath the sea. Tracing Greenland’s movement over 100 million years, carrying it over a hot spot that later formed Iceland. Credit: NASA’s Scientific Visualization Studio; Blue Marble data courtesy of Reto Stockli (NASA Goddard) The scar’s track through Greenland still shows a measurable heat signature, according to a study published in August 2018. Led by Yasmina M. Martos, a planetary scientist at NASA’s Goddard Space Flight Center in Greenbelt, Maryland, the research team used data previously gathered on Greenland’s magnetic and gravitational profiles to reveal the scar’s location. They also tracked its heat, tracing the scar from northwestern to southeastern Greenland. “It may mean that Greenland can expel its ice faster than we are anticipating in predictive models,” Ivins said. He was part of a science team that recently explored the implications of another hot spot on the opposite side of the planet: A deep mantle plume believed to lie below Marie Byrd Land in West Antarctica. Tracking a hot spot Ivins and JPL researcher Hélène Seroussi, along with others, devised a detailed, three-dimensional computer model of how heat from such a plume might affect the base of the Antarctic ice sheet. A big question: How much heat is too much? In other words, what level of heat from the plume would match changes observed on Antarctica’s surface? The possible plume’s exact size, temperature and location were unknown, despite new seismic imaging information that had begun to improve the picture. And direct measurements of geothermal heat flux from below the ice are extremely rare. But Seroussi and Ivins had the next best thing: satellite and airborne observations of the height of the ice sheet. This fluctuates from place to place as the ice melts from below, causing sudden drops, for instance, when rivers of meltwater at the ice sheet’s base drain rapidly into subglacial lakes downstream. Too much heat from the plume in the computer model would lead to much higher melt-rates than the observations revealed. The model, informed by observations from NASA’s orbiting IceSat satellite, as well as the airborne Operation IceBridge, delivered a solid verdict: while the heat was high beneath Marie Byrd Land, the greatest ice-height variability – and hence the highest heat flow – was located hundreds of kilometers to the west. Here the rates of lake-to-lake water-flows below the ice sheet were also significantly higher. Seismic observations of the area offered further evidence – signs of a rift in Earth’s crust, a great place for heat from the mantle to reach toward the surface. Illustration of lakes and waterways beneath Antarctic ice. Beneath Antarctic ice are systems of lakes (blue dots) and rivers (lines). One recent study found evidence of a heat source called a mantle plume beneath the frozen continent’s Marie Byrd Land. Image credit: NSF/Zina Deretsky. This heat flow is quite subtle, between 150 and 180 milliwatts per square meter. A milliwatt is one thousandth of a watt. Make such a measurement in California’s San Gabriel Mountains, near JPL, and you’ll get readings as high as 60 to 80 milliwatts per square meter. Take the temperature in a place like Yellowstone National Park, known for its high level of geothermal activity, and expect up to 220 milliwatts per square meter over broad regions away from the park’s famous geysers. Subtle as it might be, however, the plume’s “heat flux” could be enough to speed up the melting of the ice sheet. Estimating just how much, and the potential future effects on sea level, will require teasing apart the modest, background heating of the mantle plume – acting over tens of millions of years – from the more powerful, short-term effect of a warming ocean. “It can impact the properties of the ice, but the changes still have to be triggered by something else,” Seroussi, the lead author of the 2017 modeling study, said of the under-ice mantle plume. Such plumes “have been there forever, will be there forever. The ice changes slowly; these things change even slower than the time-scale of the ice. They’ve been there a very long time.”
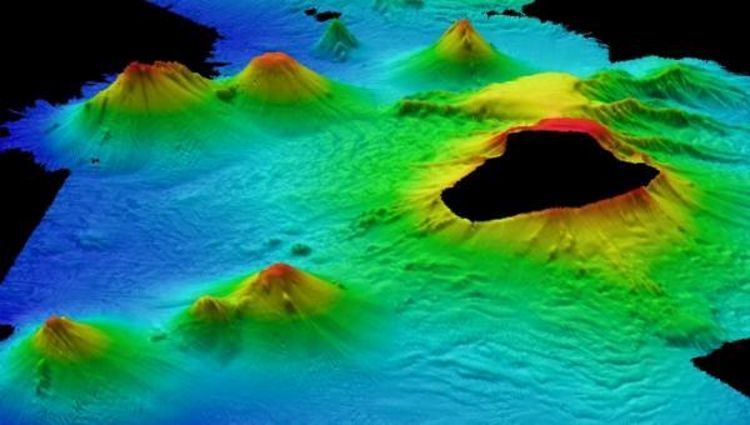
RELATED BLOG FROM THE UNIVERSITY OF OSLO: HOTSPOT VOLCANISM ON GREENLAND

Hotspot volcanism on Greenland – A corridor in the North Atlantic forms volcanic landscape
Volcanic activity primarily focuses at plate boundaries on Earth. But volcanoes can also form far away from plate boundaries due to plumes of hot material rising from the Earth’s deep interior. Eventually this material reaches the surface and breaks through the Earth’s crust to form a volcano – a so-called “hotspot”. Scientists now present a theory of how this type of hotspot activity can explain massive, past volcanic eruptions in Greenland and in the North Atlantic.
Greenland is the largest island on Earth. In central Greenland researchers have located a corridor with thinned-out landmasses running from east to west, which they explain by Greenland drifting over a stationary hotspot. The thin lithosphere assisted volcanic activities across Greenland 60 million years ago. Illustration photo: Colourbox.no
Greenland is the largest island on Earth. In central Greenland researchers have located a corridor with thinned-out landmasses running from east to west, which they explain by Greenland drifting over a stationary hotspot. The thin lithosphere assisted volcanic activities across Greenland 60 million years ago. Illustration photo: Colourbox.no
In Nature Geoscience, a group of researchers present a new theory and model of processes leading to volcanic activities on both sides of Greenland and in the North Atlantic region that started simultaneously at around 60 million years ago.
As lithospheric plates (the outer shell of our planet) move across a hotspot, volcanic island chains form. One of the most famous chains is the string of volcanoes on the seafloor that connect to Hawaii in the Pacific. Across in the Atlantic Ocean, Iceland is also a well-known site of active volcanism today that is related to a deep hot upwelling (a plume) but a similar string of volcanoes had not been previously found.
However, on Greenland and across the North Atlantic region there are vast amounts of extinct volcanoes that erupted around 60 million years ago. These volcanoes are not arranged in chains but instead are distributed over a large area, so they do not intuitively appear as traditional hotspot volcanism.
One of the authors of the article, Professor Trond H Torsvik (CEED, University of Oslo), says:
“It has remained an open question whether this widespread volcanism was caused by the Iceland plume as a single source. To address this we combined recent results from plate reconstructions, seismic tomography and geodynamic modelling to assess where the plume impacted and how and where plume material could have flowed beneath the lithosphere so as to give rise to the observed volcanism”.
However, the interdisciplinary group of scientists from Germany, Ireland, Canada and Norway demonstrate that these volcanoes can also explained by hotspot activity.
The research team, led by Bernhard Steinberger (GFZ and CEED), used high-resolution tomographic images – a technique to image Earth’s interior structure based on earthquake data – to locate a thinned-out corridor within the Earth’s lithosphere (Figure 1). The corridor they found stretches from east to west across central Greenland.
This feature may have been formed when Greenland moved westwards 90 to 60 million years ago over and across the Iceland plume (hotspot) that is still active within the Earth’s interior.
Figure 1 Greenland moved westward (red arrows) over an active and near stationary Iceland plume between 90 and 60 million years ago (Ma) which resulted in an east–west corridor of thinned lithosphere across Central Greenland (panel a). Perhaps because of stronger plume activity from ~60 Ma, hot material sourced by the Iceland plume broke through the Earth’s crust and simultaneous volcanic activity is observed on either side of Greenland (dated volcanic locations at that time shown as red-shaded circles in panel b). The Iceland Plume was centred beneath eastern Greenland (yellow star in panel b) at 60 Ma and some plume-related magma had been dragged more than 1000 km at the base of the moving lithosphere to remain near the western margin of Greenland, but some magma also travelled SSW along the eastern coast of Greenland and toward Scotland and Ireland. Panel a graphics by Alisha Steinberger.
The research team reconstructed the activity of the Iceland Plume with high precision for the past 90 million years, but:
“After reconstructing the activity of the Iceland plume we were still looking for an explanation why, if the hotspot was already active 90 million years ago in the west of Greenland, volcanic activity only started about 60 million years ago.” explains Steinberger.
With a new model the scientists were able to reconstruct how hot material rising from the plume accumulated within the corridor. They found that the hot material caused the Earth’s lithosphere to be thinned out gradually, starting 90 million years ago (Ma).
Steinberger continues: “We surmise that the accumulation and flow of hot material in the Earth interior, together with the process of plates drifting apart towards East and West, caused the originally thick lithosphere to thin out over the course of millions of years. These geological processes eventually led to the eruption of volcanoes started 60 million years ago and their arrangement at both ends of the landmass”.
What is today known as the Iceland Plume was earlier centred beneath eastern Greenland at 60 Ma (Figure 1) and magma must have propagated horizontally more than 1000 km at the base of the thinned lithospheric corridor across central Greenland.
At the same time, magma also flowed southwards towards the British Isles, within an area that had undergone extensive continental stretching for several hundred million years.
“Iceland plume material flowed to the most thinned rifted lithosphere, and eventually also triggered continental breakup between Greenland and Eurasia (Norway) around 55 Ma because of upside-down drainage of the plume head”, explains Trond H. Torsvik.
Original study: Steinberger, B., Bredow, E., Lebedev, S., Schaeffer, A., Torsvik, T.H. 2018. Widespread volcanism in the Greenland-North Atlantic region explained by the Iceland plume. Nature Geoscience
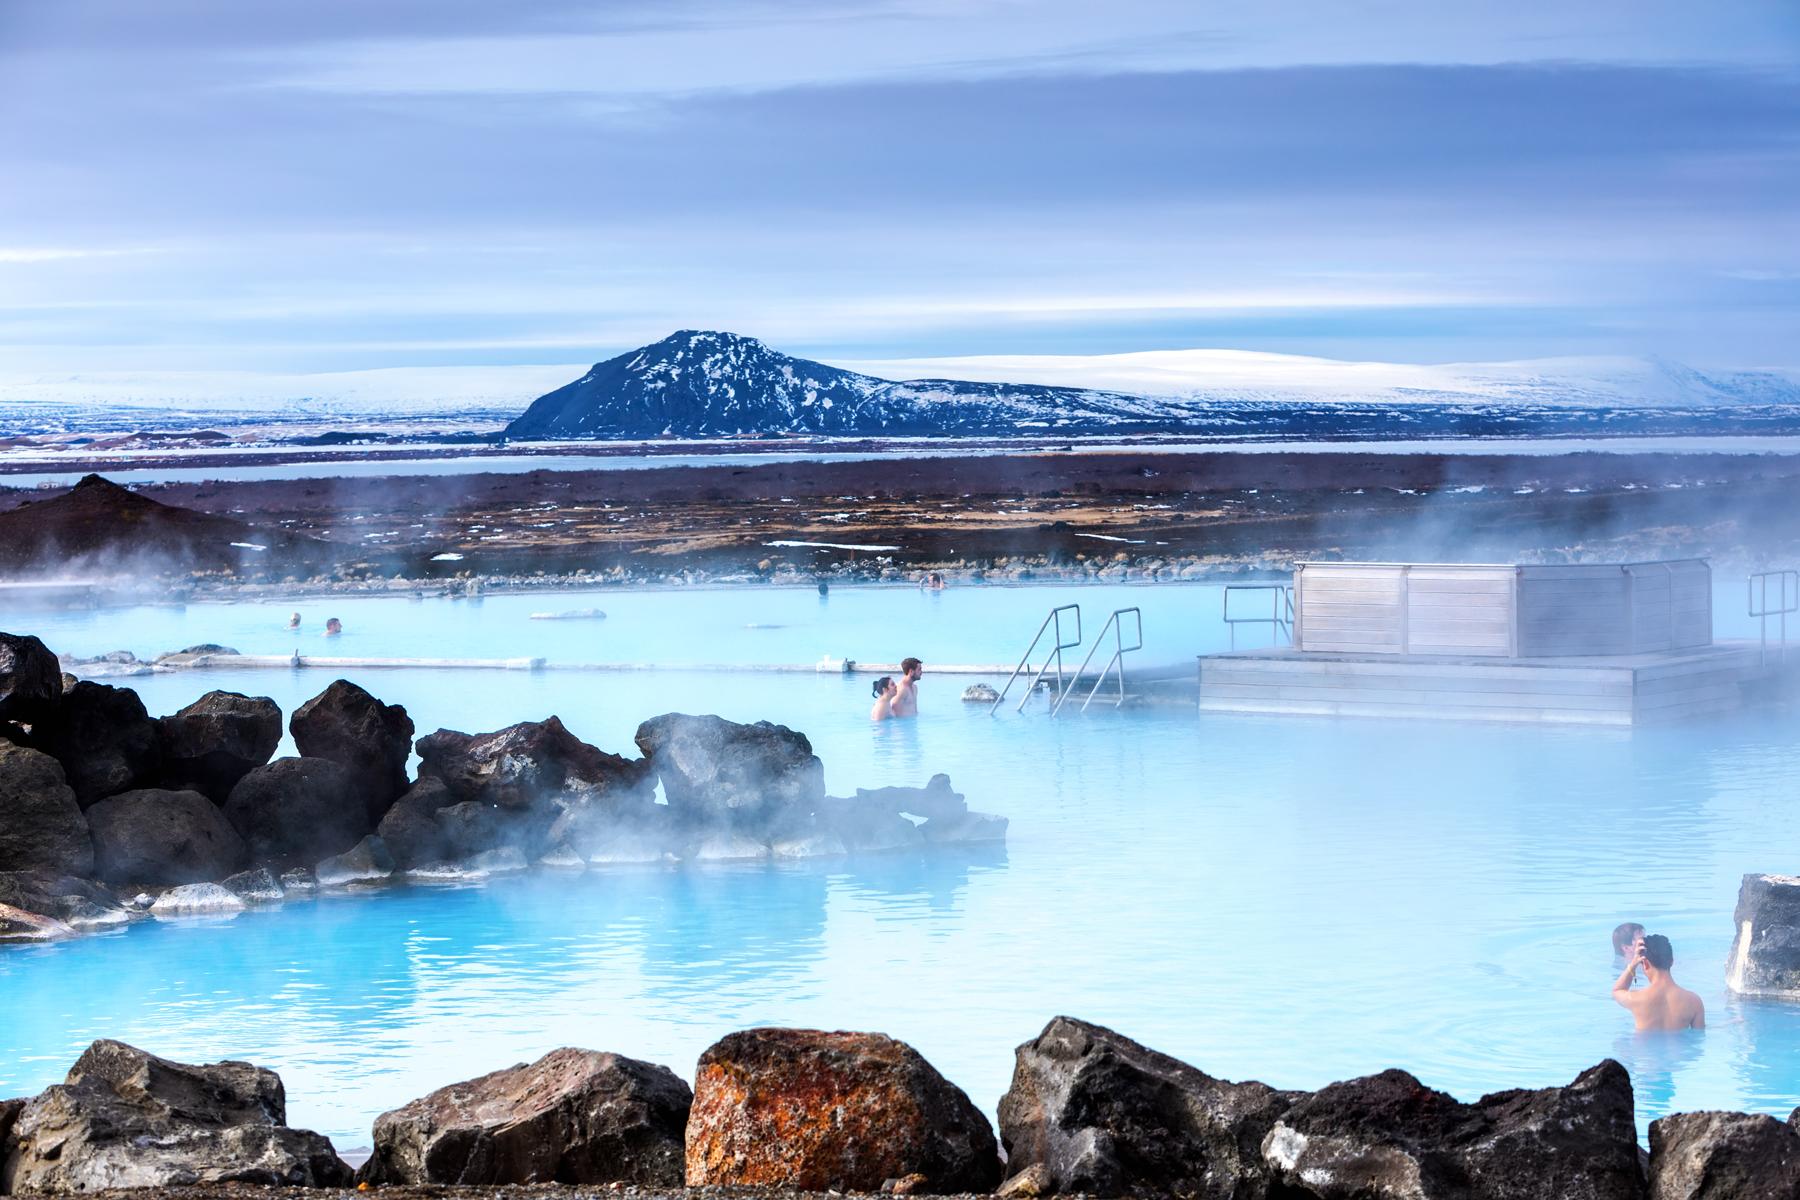
GEOTHERMAL HOT POOLS IN ICELAND


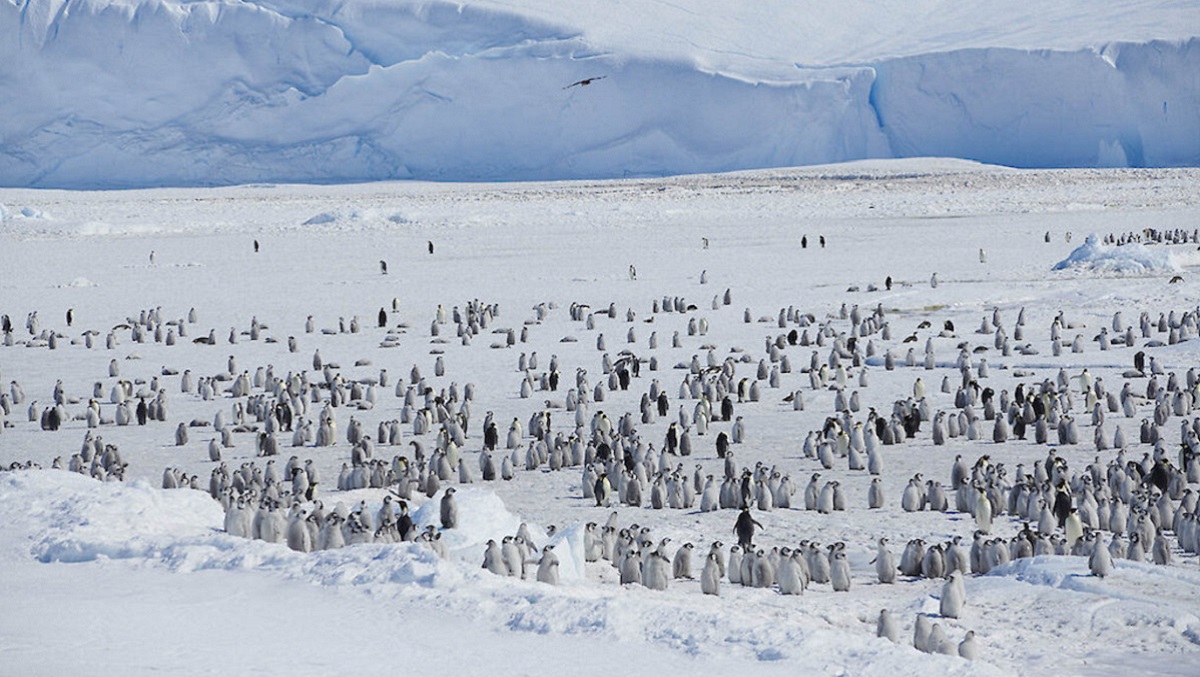
LIST OF ANTARCTICA POSTS
Posted on: October 30, 2020


- IS CLIMATE CHANGE MELTING ANTARCTIC GLACIERS? https://tambonthongchai.com/2020/10/16/is-climate-change-melting-glaciers-in-antarctica/
- ANTARCTICA ICE MELT AND SEA LEVEL RISE: https://tambonthongchai.com/2020/10/11/antarctica-ice-melt-sea-level-rise-2020/
- THE ICE SHELVES OF ANTARCTICA: https://tambonthongchai.com/2020/08/11/the-ice-shelves-of-antarctica/
- GLOBAL WARMING IN ANTARCTICA; https://tambonthongchai.com/2020/07/20/global-warming-antarctica/
- FOSSIL FUELS MELTING ANTARCTICA: https://tambonthongchai.com/2020/03/22/10684/
- A HEAT WAVE IN ANTARCTICA: https://tambonthongchai.com/2020/02/26/antarctica-heat-wave-of-2020/
- ANTARCTICA THREATENS FLORIDA: https://tambonthongchai.com/2020/02/09/antarctica-threatens-florida/
- CLIMATE CHANGE MELTING GLACIERS IN ANTARCTICA; https://tambonthongchai.com/?s=ANTARCTICA
- SOME GEOLOGICAL FEAUTURES OF ANTARCTICA: https://tambonthongchai.com/2019/06/27/antarctica/

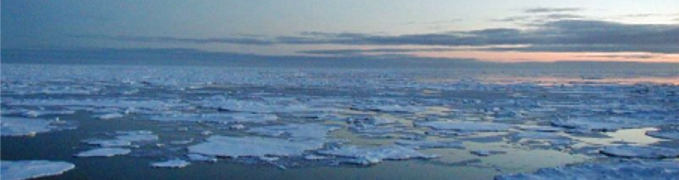
IT IS REPORTED IN THE MEDIA: LINK: https://www.theguardian.com/world/2020/oct/22/alarm-as-arctic-sea-ice-not-yet-freezing-at-latest-date-on-record that anthropogenic global warming is causing extreme and dangerous heat anomalies in the Arctic that have devastating implications in terms of feedback acceleration and the future evolution of catastrophic global warming. The Guardian has written what climate scientists have told them about this sea ice event.
WHAT CLIMATE SCIENTISTS SAY
Alarm as Arctic sea ice not yet freezing at latest date on record
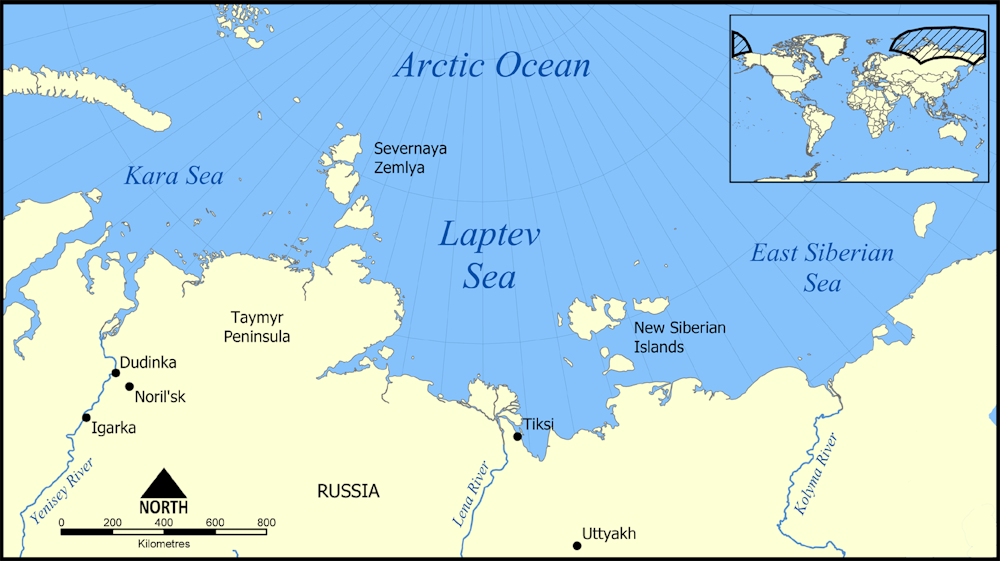
Delayed freeze in Laptev Sea could have knock-on effects across polar region. Climate change is pushing warmer Atlantic currents into the Arctic and breaking up the usual stratification between warm deep waters and the cool surface. This also makes it difficult for ice to form. For the first time since records began, the main nursery of Arctic sea ice in Siberia has yet to start freezing in late October. The delayed annual freeze in the Laptev Sea has been caused by freakishly protracted warmth in northern Russia and the intrusion of Atlantic waters, say climate scientists who warn of possible knock-on effects across the polar region. Ocean temperatures in the area recently climbed to more than 5C above average, following a record breaking heatwave and the unusually early decline of last winter’s sea ice. The trapped heat takes a long time to dissipate into the atmosphere, even at this time of the year when the sun creeps above the horizon for little more than an hour or two each day. Graphs of sea-ice extent in the Laptev Sea, which usually show a healthy seasonal pulse, appear to have flat-lined. As a result, there is a record amount of open sea in the Arctic.
“The lack of freeze-up so far this fall is unprecedented in the Siberian Arctic region,” said Zachary Labe, a postdoctoral researcher at Colorado State University. He says this is in line with the expected impact of human-driven climate change. 2020 is another year that is consistent with a rapidly changing Arctic. Without a systematic reduction in greenhouse gases, the likelihood of our first ‘ice-free’ summer will continue to increase by the mid-21st century,” (Zack Labe). This year’s Siberian heatwave was made at least 600 times more likely by industrial and agricultural emissions, according to an earlier study. The warmer air temperature is not the only factor slowing the formation of ice. Climate change is also pushing more balmy Atlantic currents into the Arctic and breaking up the usual stratification between warm deep waters and the cool surface. This also makes it difficult for ice to form. This continues a streak of very low extents. The last 14 years, 2007 to 2020, are the lowest 14 years in the satellite record starting in 1979,. The Arctic is now disappearing, leaving thinner seasonal ice. Overall the average thickness is half what it was in the 1980s.The downward trend is likely to continue until the Arctic has its first ice-free summer. The data and models suggest this will occur between 2030 and 2050. “It’s a matter of when, not if. Scientists are concerned the delayed freeze could amplify feedbacks that accelerate the decline of the sea ice. It is already well known that a smaller area of ice means less of a white area to reflect the sun’s heat back into space. But this is not the only reason the Arctic is warming more than twice as fast as the global average. The Laptev Sea is known as the birthplace of ice, which forms along the coast there in early winter, then drifts westward carrying nutrients across the Arctic, before breaking up in the spring in the Fram Strait between Greenland and Svalbard. If ice forms late in the Laptev, it will be thinner and thus more likely to melt before it reaches the Fram Strait. This could mean fewer nutrients for Arctic plankton, which will then have a reduced capacity to draw down carbon dioxide from the atmosphere. More open sea also means more turbulence in the upper layer of the Arctic ocean, which draws up more warm water from the depths. The sea ice trends are grim but not surprising. “It is more frustrating than shocking. This has been forecast for a long time, but there has been little substantial response by decision-makers.
CRITICAL COMMENTARY
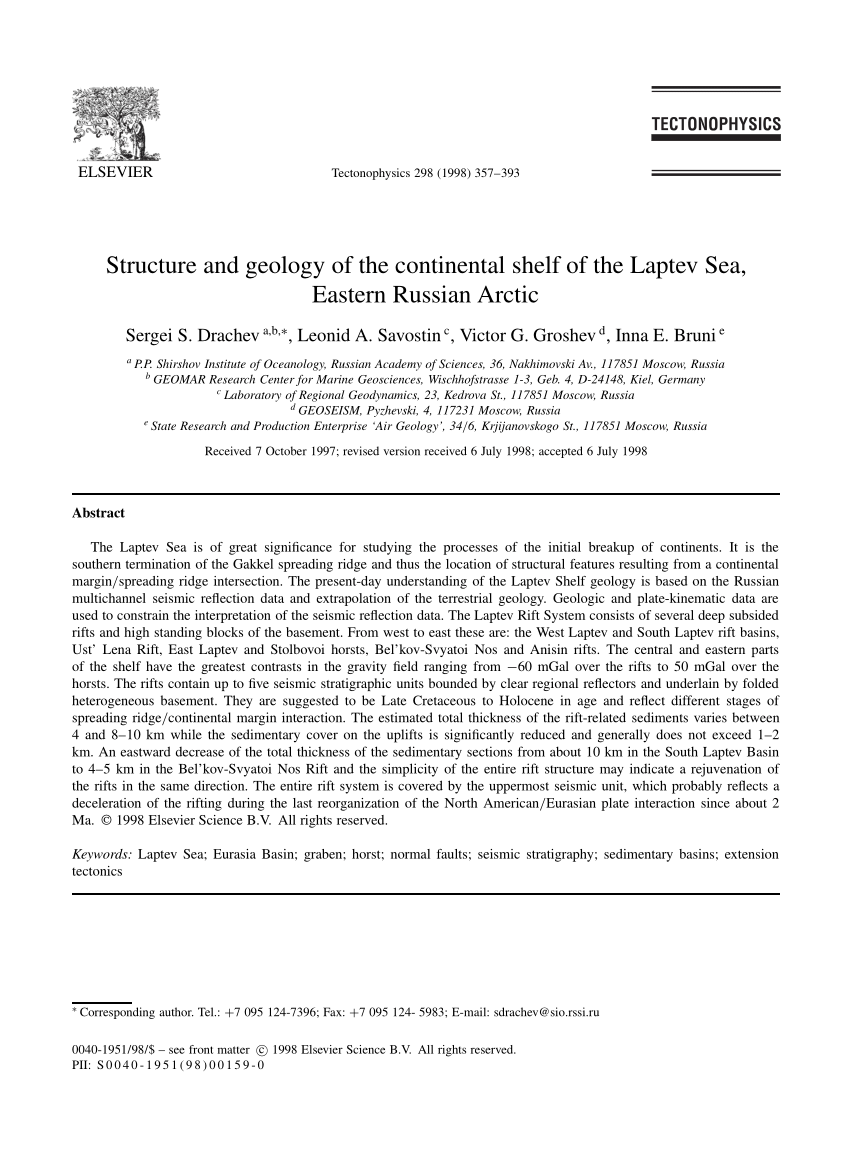
ABOUT THE LAPTEV SEA: The Laptev Sea is the southern termination of the Gakkel spreading ridge. The Laptev Rift System consists of several deep subsided rifts and high standing blocks of the basement. Details of this geological feature are described by Sergey Drachev in his paper on the geology of the continental shelf of the Laptev Sea. The full text of the paper is available on request. The Arctic is geologically active and its temperature and sea ice dynamics cannot be understood exclusively in terms of the atmosphere above the sea ice without consideration of the geology of the region below the sea ice described in a related post on this site : LINK: https://tambonthongchai.com/2019/07/01/arctic/ . Further evidence of geological activity and hydrothermal venting in this regions is described in the bibliography below and in a summary of the relevant information on geological activity in the Laptev Sea area of the Arctic. Based on these data we propose that sea ice dynamics in this region cannot be understood exclusively in terms of atmospheric phenomena. Statistical analysis of Arctic sea ice dynamics does not show a correlation with atmospheric temperature phenomena. Details of this issue are presented in related posts on this site listed below.

RELATED POSTS ON ARCTIC SEA ICE DYNAMICS
- Precipitous Decline in Arctic Sea Ice Volume https://tambonthongchai.com/2019/11/07/precipitous-decline-in-arctic-sea-ice-volume/
- Sea Ice Extent & Area 1979-2019 https://tambonthongchai.com/2019/09/28/sea-ice-extent-area-1979-2018/
- Does Global Warming Drive Changes in Arctic Sea Ice? https://tambonthongchai.com/2018/08/04/does-global-warming-drive-changes-in-arctic-sea-ice/
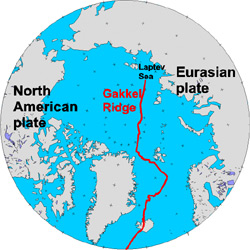
GEOLOGY OF THE GAKKEL RIDGE AND LAPTEV SEA RIFT SYSTEM
The Laptev Sea is south of the Gakkel slow spreading ridge. This region is geologically active with seafloor geological features consisting of episodic but intense events of hydrothermal plumes, explosive volcanism, and magmatic flows. Sea ice dynamics and extreme ocean temperature anomalies in this region cannot be understood strictly in terms of atmospheric phenomena such as anthropogenic global warming particularly so when the sea ice dynamics at issue are episodic, localized, and extreme. In light of the influence of the Gakkel Ridge, the study of sea ice and sea surface temperature events in the region must be inclusive of these geological features. The Arctic in general is a very geologically active area and the study of ice melt and ocean temperature events in there must pay attention to these significant sources of heat. A RELEVANT BIBLIOGRAPHY ON THIS TOPIC IS PROVIDED BELOW FOR REFERENCE.


In the bibliography provided below we find strong support for intense episodic geological events in this region in the form of magmatic events, explosive volcanism, and hydrothermal plumes. It is not possible to interpret localized heat and ice melt episodic events in such locations exclusively as atmospheric phenomena or impacts of anthropogenic global warming with the implication that they can and must be attenuated by taking climate action.

THE RELEVANT BIBLIOGRAPHY
- Baker, Edward T., et al. “Hydrothermal venting in magma deserts: The ultraslow‐spreading Gakkel and Southwest Indian Ridges.” Geochemistry, Geophysics, Geosystems 5.8 (2004). Detailed hydrothermal surveys over ridges with spreading rates of 50–150 mm/yr have found a linear relation between spreading rate and the spatial frequency of hydrothermal venting, but the validity of this relation at slow and ultraslow ridges is unproved. Here we compare hydrothermal plume surveys along three sections of the Gakkel Ridge (Arctic Ocean) and the Southwest Indian Ridge (SWIR) to determine if hydrothermal activity is similarly distributed among these ultraslow ridge sections and if these distributions follow the hypothesized linear trend derived from surveys along fast ridges. Along the Gakkel Ridge, most apparent vent sites occur on volcanic highs, and the extraordinarily weak vertical density gradient of the deep Arctic permits plumes to rise above the axial bathymetry. Individual plumes can thus be extensively dispersed along axis, to distances >200 km, and ∼75% of the total axial length surveyed is overlain by plumes. Detailed mapping of these plumes points to only 9–10 active sites in 850 km, however, yielding a site frequency Fs, sites/100 km of ridge length, of 1.1–1.2. Plumes detected along the SWIR are considerably less extensive for two reasons: an apparent paucity of active vent fields on volcanic highs and a normal deep‐ocean density gradient that prevents extended plume rise. Along a western SWIR section (10°–23°E) we identify 3–8 sites, so Fs = 0.3–0.8; along a previously surveyed 440 km section of the eastern SWIR (58°–66°E), 6 sites yield Fs = 1.3. Plotting spreading rate (us) versus Fs, the ultraslow ridges and eight other ridge sections, spanning the global range of spreading rate, establish a robust linear trend (Fs = 0.98 + 0.015us), implying that the long‐term heat supply is the first‐order control on the global distribution of hydrothermal activity. Normalizing Fs to the delivery rate of basaltic magma suggests that ultraslow ridges are several times more efficient than faster‐spreading ridges in supporting active vent fields. This increased efficiency could derive from some combination of three‐dimensional magma focusing at volcanic centers, deep mining of heat from gabbroic intrusions and direct cooling of the upper mantle, and nonmagmatic heat supplied by exothermic serpentinization.
- Edwards, M. H., et al. “Evidence of recent volcanic activity on the ultraslow-spreading Gakkel ridge.” Nature 409.6822 (2001): 808-812. Seafloor spreading is accommodated by volcanic and tectonic processes along the global mid-ocean ridge system. As spreading rate decreases the influence of volcanism also decreases1,2,3,4, and it is unknown whether significant volcanism occurs at all at ultraslow spreading rates (<1.5 cm yr-1). Here we present three-dimensional sonar maps of the Gakkel ridge, Earth’s slowest-spreading mid-ocean ridge, located in the Arctic basin under the Arctic Ocean ice canopy. We acquired this data using hull-mounted sonars attached to a nuclear-powered submarine, the USS Hawkbill. Sidescan data for the ultraslow-spreading (∼1.0 cm yr-1) eastern Gakkel ridge depict two young volcanoes covering approximately 720 km2 of an otherwise heavily sedimented axial valley. The western volcano coincides with the average location of epicentres for more than 250 teleseismic events detected5,26 in 1999, suggesting that an axial eruption was imaged shortly after its occurrence. These findings demonstrate that eruptions along the ultraslow-spreading Gakkel ridge are focused at discrete locations and appear to be more voluminous and occur more frequently than was previously thought.
- Sohn, Robert A., et al. “Explosive volcanism on the ultraslow-spreading Gakkel ridge, Arctic Ocean.” Nature 453.7199 (2008): 1236-1238. Roughly 60% of the Earth’s outer surface is composed of oceanic crust formed by volcanic processes at mid-ocean ridges. Although only a small fraction of this vast volcanic terrain has been visually surveyed or sampled, the available evidence suggests that explosive eruptions are rare on mid-ocean ridges, particularly at depths below the critical point for seawater (3,000 m)1. A pyroclastic deposit has never been observed on the sea floor below 3,000 m, presumably because the volatile content of mid-ocean-ridge basalts is generally too low to produce the gas fractions required for fragmenting a magma at such high hydrostatic pressure. We employed new deep submergence technologies during an International Polar Year expedition to the Gakkel ridge in the Arctic Basin at 85° E, to acquire photographic and video images of ‘zero-age’ volcanic terrain on this remote, ice-covered ridge. Here we present images revealing that the axial valley at 4,000 m water depth is blanketed with unconsolidated pyroclastic deposits, including bubble wall fragments (limu o Pele)2, covering a large (>10 km2) area. At least 13.5 wt% CO2 is necessary to fragment magma at these depths3, which is about tenfold the highest values previously measured in a mid-ocean-ridge basalt4. These observations raise important questions about the accumulation and discharge of magmatic volatiles at ultraslow spreading rates on the Gakkel ridge5 and demonstrate that large-scale pyroclastic activity is possible along even the deepest portions of the global mid-ocean ridge volcanic system.
- Michael, P. J., et al. “Magmatic and amagmatic seafloor generation at the ultraslow-spreading Gakkel ridge, Arctic Ocean.” Nature 423.6943 (2003): 956-961. A high-resolution mapping and sampling study of the Gakkel ridge was accomplished during an international ice-breaker expedition to the high Arctic and North Pole in summer 2001. For this slowest-spreading endmember of the global mid-ocean-ridge system, predictions were that magmatism should progressively diminish as the spreading rate decreases along the ridge, and that hydrothermal activity should be rare. Instead, it was found that magmatic variations are irregular, and that hydrothermal activity is abundant. A 300-kilometre-long central amagmatic zone, where mantle peridotites are emplaced directly in the ridge axis, lies between abundant, continuous volcanism in the west, and large, widely spaced volcanic centres in the east. These observations demonstrate that the extent of mantle melting is not a simple function of spreading rate: mantle temperatures at depth or mantle chemistry (or both) must vary significantly along-axis. Highly punctuated volcanism in the absence of ridge offsets suggests that first-order ridge segmentation is controlled by mantle processes of melting and melt segregation. The strong focusing of magmatic activity coupled with faulting may account for the unexpectedly high levels of hydrothermal activity observed.
- Edmonds, H. N., et al. “Discovery of abundant hydrothermal venting on the ultraslow-spreading Gakkel ridge in the Arctic Ocean.” Nature 421.6920 (2003): 252-256. Submarine hydrothermal venting along mid-ocean ridges is an important contributor to ridge thermal structure1, and the global distribution of such vents has implications for heat and mass fluxes from the Earth’s crust and mantle and for the biogeography of vent-endemic organisms. Previous studies have predicted that the incidence of hydrothermal venting would be extremely low on ultraslow-spreading ridges (ridges with full spreading rates <2 cm yr-1—which make up 25 per cent of the global ridge length), and that such vent systems would be hosted in ultramafic in addition to volcanic rocks4,5. Here we present evidence for active hydrothermal venting on the Gakkel ridge, which is the slowest spreading (0.6–1.3 cm yr-1) and least explored mid-ocean ridge. On the basis of water column profiles of light scattering, temperature and manganese concentration along 1,100 km of the rift valley, we identify hydrothermal plumes dispersing from at least nine to twelve discrete vent sites. Our discovery of such abundant venting, and its apparent localization near volcanic centres, requires a reassessment of the geologic conditions that control hydrothermal circulation on ultraslow-spreading ridges.
- Hellebrand, Eric, Jonathan E. Snow, and Richard Mühe. “Mantle melting beneath Gakkel Ridge (Arctic Ocean): abyssal peridotite spinel compositions.” Chemical Geology 182.2-4 (2002): 227-235. The ultraslow spreading Gakkel Ridge represents one of the most extreme spreading environments on the Earth. Full spreading rates there of 0.6–1.3 cm/year and Na8.0 in basalts of 3.3 imply an extremely low degree of mantle partial melting. For this reason, the complementary degree of melting registered by abyssal peridotite melting residues is highly interesting. In a single sample of serpentinized peridotite from Gakkel Ridge, we found spinels which, though locally altered, have otherwise unzoned and thus primary compositions in the cores of the grains. These reflect a somewhat higher degree of melting of the uppermost oceanic mantle than indicated by basalt compositions. Cr/(Cr+Al) ratios of these grains lie between 0.23 and 0.24, which is significantly higher than spinels from peridotites collected along the faster spreading Mid-Atlantic and Southwest Indian Ridges. Crustal thickness at Gakkel Ridge can be calculated from the peridotite spinel compositions, and is thicker than the crustal thickness of less than 4 km estimated from gravity data, or predicted from global correlations between spreading rate and seismically determined crustal thickness. The reason for this unexpected result may be local heterogeneity due to enhanced melt focussing at an ultraslow spreading ridge.
- Tolstoy, M., et al. “Seismic character of volcanic activity at the ultraslow-spreading Gakkel Ridge.” Geology 29.12 (2001): 1139-1142. Never before has a volcanic eruption on a slow- or ultraslow- spreading mid-ocean ridge been both observed seismically and confirmed on the seafloor. During the first half of 1999, a long-lived volcanic-spreading event occurred on the ultraslow-spreading Gakkel Ridge in the Arctic Ocean. The seismicity associated with this event was unprecedented in duration and magnitude for a seafloor eruption. Sonar images from the U.S.S. Hawkbill, which passed over the area within four months of the start of activity, are consistent with the presence of a large, recently erupted flow and a volcanic peak directly in the area of seismic activity. Seismic activity began in mid-January and continued vigorously for three months; a reduced rate of activity persisted for an additional four months or more. In total, 252 events were large enough to be recorded on global seismic networks. Although a limited number of volcanic-spreading events have been observed globally, the duration and magnitude of the Gakkel Ridge swarm, when compared with volcanic seismicity at ridges spreading at intermediate and fast spreading rates, suggest that a negative power-law relationship may exist between these parameters and spreading rate. Fault activation, in response to magmatic emplacement, appears to have occurred over a broad region, suggesting that magma may have been tapped from mantle depths. The slow migration of the largest magnitude events along the axis of the rift valley suggests multiple magmatic pulses at depth. In combination with bathymetric setting and sidescan sonar confirmation, the seismic data for this event have provided a unique look at the scale and character of eruption processes at ultraslow-spreading rates.
GLOBALWARMING 1979-2020
Posted on: October 27, 2020

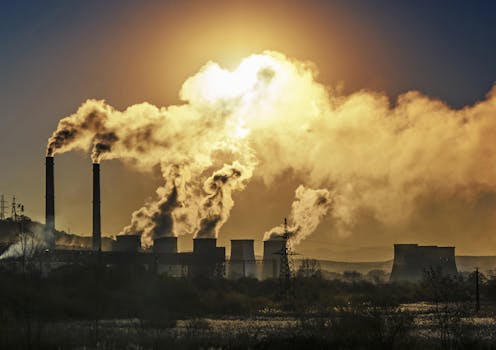
THIS POST IS A GRAPHICAL PRESENTATION OF THE UAH LOWER TROPOSPHERE TEMPERATURE DATASET 1979-2020.
COMMENTARY
DATA AND METHODS: UAH lower troposphere temperature data from 1979 to 2020 are used to examine global warming patterns across eight latitudinal regions of the globe. These are 1. [global land and ocean], 2. [global land only], 3. [global ocean only], and both land and ocean in these sub-global regions 4. [tropics], 5. [northern extent], 6. [southern extent], 7. [north polar region], and 8. [south polar region]. The data are studied separately for the twelve calendar months to accommodate significant differences among the calendar months. Full span warming trends along with decadal trends in a moving 10-year are studied. The moving decadal window moves through the time series one year at a time. The graphical presentation of the data include a GIF image that cycles through the twelve calendar months displaying the temperature and decadal trend patterns across the full span of the data from 1979 to 2020.An annualized summary of the data in the GIF image is provided under the GIF image. As of this writing, data for the months of October to December are not available for the year 2020 and these values were estimated from an extrapolation of the pattern seen in the previous two years.
FINDINGS: (1) The annualized summary of full span temperature trends shows large differences in warming rates among the calendar months with significant regional differences. For global land and ocean, these trend values range from 0.0115C/year in June to 0.0160/year for February and September. The warming rates are much higher for land and somewhat lower for ocean.
(2) An interesting pattern seen in the trends of the decadal trends. Most months show a strong acceleration in the warming rate near the end of the time series beginning somewhere around 2008 and gaining intensity all the way to 2020. This behavior varies among the calendar months in terms of the steepness of the acceleration and among the regions in terms the number of calendar months that show this behavior as well as the steepness of the annual mean acceleration. The strongest acceleration is seen in the Northern Extent region and the Tropics. The weakest acceleration is seen in the Polar regions with the South Polar region showing deceleration. In terms of surface type, land warming rates and accelerations are stronger than ocean warming rates and accelerations.
(3) The strong acceleration of the warming rate towards the end of the time series that sustains and gets stronger over time appears to be inconsistent with recent reports in online sources that the CO2 greenhouse effect of the atmosphere is approaching saturation such that warming is expected to stop when saturation is reached {LINK: https://climatechangedispatch.com/study-more-co2-will-have-little-to-no-impact-on-global-warming/
(4) In terms of the full span warming trend, large differences are seen among the calendar months and this monthly pattern varies significantly among the regions. This pattern is as follows: Global: Strongest warming: February and September. Weakest warming: June to August. Tropics: Strongest warming: July and August. Weakest warming: March and April. Northern Extent: Strongest warming: February and March. Weakest warming: July & August. Southern Extent: Strongest Warming: January. Weakest warming: March, April, and May. North Polar: Strongest warming in July. Weakest in April. South Polar: Strongest warming: January to March. Weakest Warming: November and December when it is actually COOLING.
(5) The oddities of the Polar Regions are that the North Polar region is warming the fastest with a mean annual full span warming rate of all calendar months of 0.0250C/year while the South Polar Region is warming the slowest with a negative warming so that it is actually cooling at an rate of 0.009C/year. The corresponding rates for Global warming are: Global land and ocean = 0.0138C/year, Global land only is higher at 0.0187C/year, and Global ocean only correspondingly lower at 0.0199C/year. Of the other three regions, the Northern Extent is warming the fastest at a rate of 0.0183C per year with the Tropics at 0.0132/year and the Southern Extent warming at the lower rate of 0.01C per year.
(6) The most significant highlights of the data are (a) the observed steep acceleration in decadal warming rates towards the end of the time span that appear contrary to the proposition that global warming is slowing down and getting ready to stop, (b) the virtual absence of global warming in the South Polar Region that appears to be inconsistent with the generally held belief in climate science that ice melt events in geologically active Antarctica are caused by global warming, and (c) the observed extreme difference among the calendar months in warming behavior.
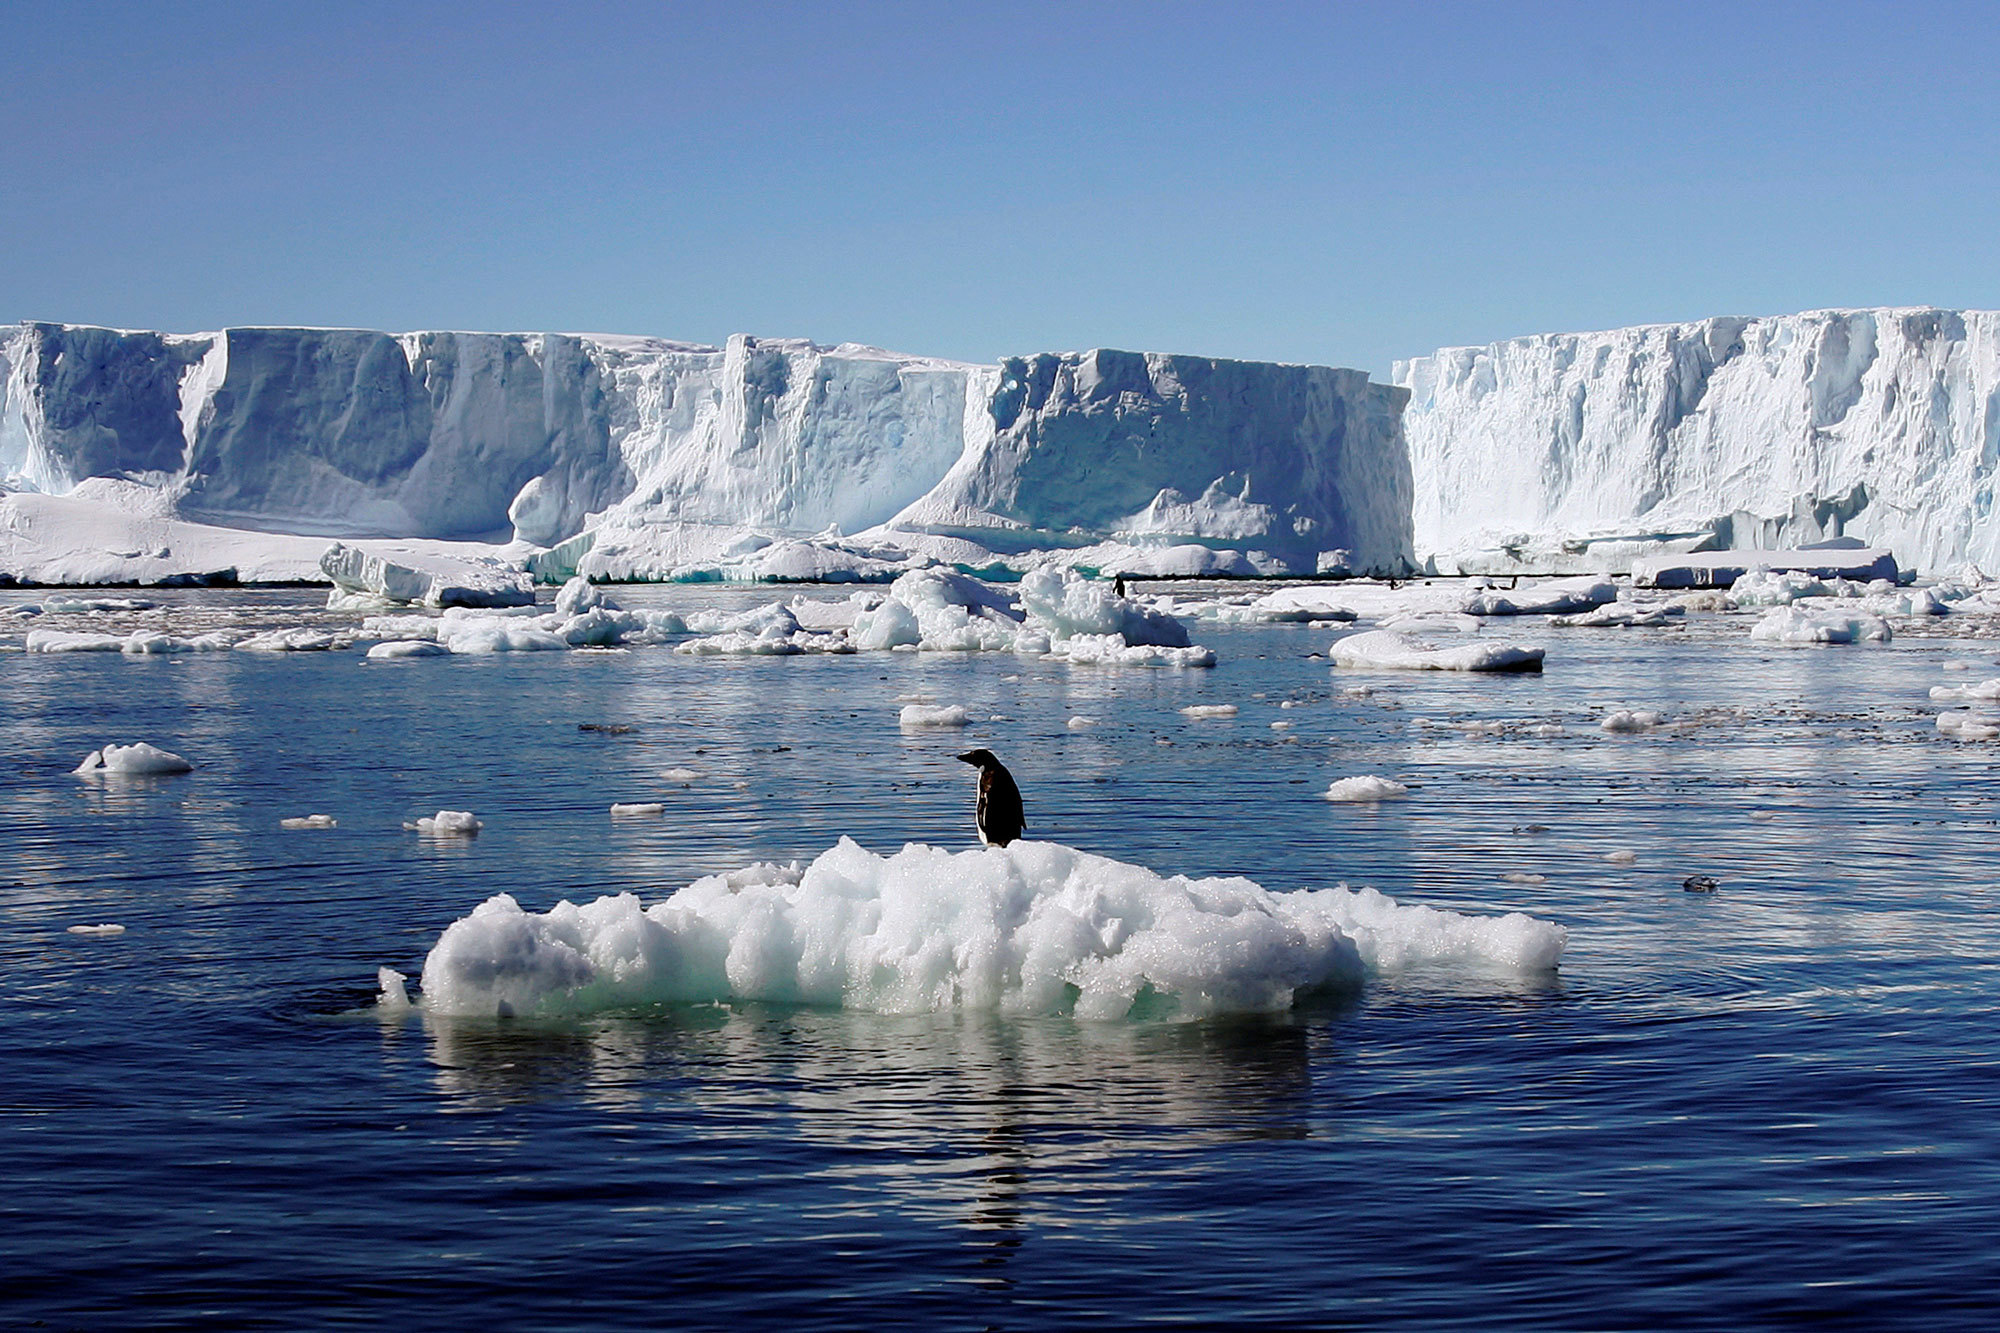
LINK TO RELATED WORK POSTED IN 2019: https://tambonthongchai.com/2020/06/22/global-warming-1979-2019/

PART-1: GLOBAL TEMPERATURES LAND AND OCEAN
TEMPERATURES AND DECADAL TRENDS BY CALENDAR MONTH

ANNUAL MEANS


PART-2: GLOBAL TEMPERATURES LAND ONLY
TEMPERATURES AND DECADAL TRENDS BY CALENDAR MONTH

ANNUAL MEANS

PART-3: GLOBAL TEMPERATURES OCEAN ONLY
TEMPERATURES AND DECADAL TRENDS BY CALENDAR MONTH

ANNUAL MEANS

PART-4: TROPICS: LAND AND OCEAN
TEMPERATURES AND DECADAL TRENDS BY CALENDAR MONTH

ANNUAL MEANS

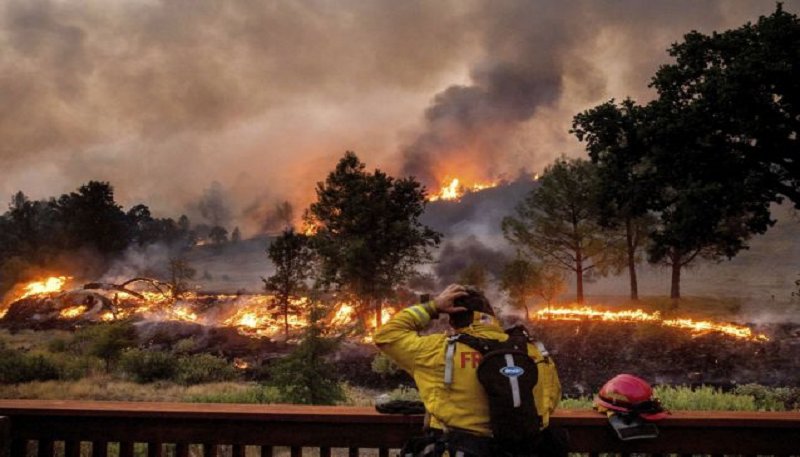
PART-5: NORTHERN EXTENT: LAND AND OCEAN
TEMPERATURES AND DECADAL TRENDS BY CALENDAR MONTH

ANNUAL MEANS


PART-6: SOUTHERN EXTENT: LAND AND OCEAN
TEMPERATURES AND DECADAL TRENDS BY CALENDAR MONTH

ANNUAL MEANS

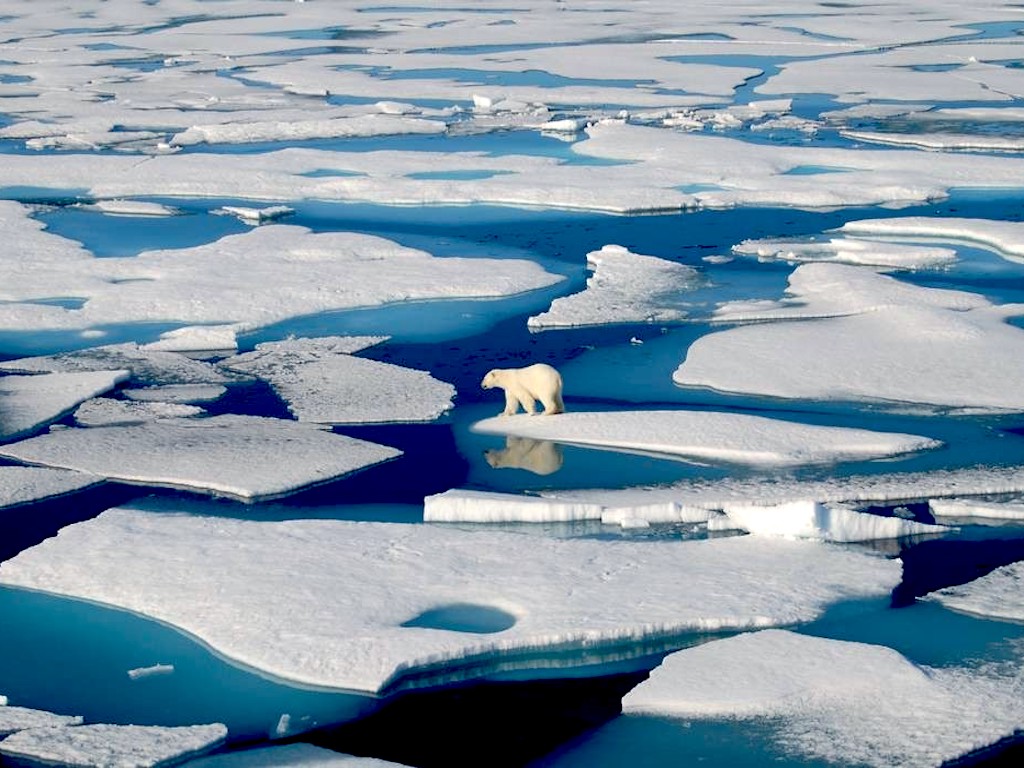
PART-7: NORTH POLAR REGION
TEMPERATURES AND DECADAL TRENDS BY CALENDAR MONTH

ANNUAL MEANS


PART-8: SOUTH POLAR REGION
TEMPERATURES AND DECADAL TRENDS BY CALENDAR MONTH

ANNUAL MEANS


CONTEXT: In late 2020, Chinese leaders made a climate change announcement that is interpreted in the West as a climate action pledge with the widely held belief in the West that the announcement means that the world’s largest fossil fuel emitter will cut emissions to fight climate change.

HERE IS THE CHINESE ANNOUNCEMENT AS REPORTED BY THE BBC
China will aim to hit peak emissions before 2030 and for carbon neutrality by 2060, President Xi Jinping has announced. Mr Xi outlined the steps China will take in a videolink to the UN General Assembly. The announcement is being seen as a significant step in the fight against climate change. China is the world’s biggest source of carbon dioxide, responsible for around 28% of global emissions.
BEFORE CHINA’S 2020 CLIMATE ACTION PLAN THEY HAD A 2015 CLIMATE ACTION PLAN: “Ahead of the Paris climate summit, Prime Minister Li Kegiang reaffirmed a November agreement to cap emissions by 2030. China plans to cut CO2 emissions 60 percent below 2005 levels and increase renewable energy consumption 20 percent by 2030. BBC”
CHINA’S ECONOMIC INTEREST IN CLIMATE ACTION
SOLAR PANEL MANFACTURE AND EXPORT

WIND TURBINE MANUFACTURING AND EXPORT

ONLINE COMMENTARIES IN THE WEST ON CHINESE CLIMATE ACTION DECLARATIONS
- ECOWATCH: China’s President Xi Jinping surprised the global community recently by committing his country to net-zero emissions by 2060. China currently accounts for about 28% of global carbon emissions – double the U.S. contribution and three times the European Union’s. Meeting the pledge will demand a deep transition of not just China’s energy system, but its entire economy. It remains to be seen whether China’s climate promise is genuine, or simply a ploy to win international favor.
- XINHUANET: There is no doubt that efforts from China will play a major role in shaping how the rest of the world progresses on climate action, especially in the absence of U.S. federal leadership.
- GUARDIAN: China will reach carbon neutrality before 2060 and ensure its greenhouse gas emissions peak in the next decade, Xi Jinping has told the UN general assembly. China will scale up its intended nationally determined contributions [under the Paris climate agreement] by adopting more vigorous policies and measures, the Chinese president said, calling for a “green recovery” from the coronavirus pandemic. The forthright commitment will give fresh impetus to the UN’s efforts to galvanise action on the climate crisis which has been flagging.
- CHINA DAILY: China’s pledge to achieve carbon neutrality by 2060-that is, netzero carbon emissions-puts the country on a transformative development path. Net-zero carbon emissions will be a ginormous turnaround in four decades and has to be done without too much negative impact on economic development. President Xi Jinping’s announcement at the United Nations on Sept 22 marked the first time China has set an absolute rather than a carbon-intensity target tied to GDP growth. In other words, it is much more ambitious. The pledge by China, as one of the world’s biggest carbon emitters, is just beginning to be digested around the world and will reverberate across energy, commodities and financial markets for a long time. Its new pledge represents a leading bid in meeting the climate-change mitigation challenge. The implications are profound.
- DIALOGO CHINO: In a virtual address to the 75th UN General Assembly on 22 September, Chinese President Xi Jinping said China would reach peak emissions before 2030 and strive to reach carbon neutrality before 2060. These pledges are a significant step forward in climate ambition from the world’s largest carbon emitter and second largest economy. All governments are required to deliver tougher climate targets under the Paris Agreement ahead of COP26, which were delayed until 2021 because of Covid-19. With commitments from the EU and China, well over a third of global emissions will be covered by new, tougher targets.
- NYT: China’s Pledge to Be Carbon Neutral by 2060: Under international pressure to do more to address global warming, Xi Jinping made a surprise commitment to drastically reduce emissions. Now comes the hard part – actually doing it.

CRITICAL COMMENTARY AND CONCLUSIONS
(1) China is the world’s largest emitter of fossil fuel emissions. With a population of 1.4 billion and per capita emissions of 7.2 metric tonnes of CO2 per person, China’s total emissions are 10.08 gigatons of CO2 that represents about 27.5% of global emissions. The climate change focus on China derives from this significant statistic. Overlooked in this statistic is that these emissions come mostly from export oriented manufacturing and not from consumption with much of the industry consisting of overseas manufacturing facilities of Western business enterprise. Although China is the largest economy in the world with a gross national GDP of $27 trillion in 2019, this figure is driven largely by industry and by population and not by consumption and living standard. A partial list of Western business enterprises that operate their factories in China, provided by JIESWORLD.COM, appears below. These factories and their products are of the West by the West and for the West but their emissions appear in China’s account. The West has exported its emissions to China.
(2) An important sector of export oriented industrial production in China that contributes to much of the fossil fuel emissions noted above, is the manufacture of solar panels, wind turbines, and electric cars for export. The importer of these products benefits from emission reduction but the emissions for their manufacture accumulate in China’s emission account. In 2019 China exported about $18 billion of solar panels with total energy production capacity of more than 200 GW. The export of wind turbines that year was $12 billion with energy capacity of more than 400 MW. Thus, much of the West’s manufacturing emissions including the emissions from the manufacture of renewable energy equipment is offloaded to China. {Footnote: China’s domestically installed renewable energy capacity is about 400 GW divided almost equally between wind and solar}.
(3): With regard to the wealth of China described as the largest economy in the world, it should be noted that the gross GDP of the country was $14.4 trillion in 2019 compared with $21.4 trillion for the USA but in terms of purchasing power parity (PPP), the adjusted PPP GDP are China $25.3 and USA $17 trillion. This PPP-GDP comparison is the basis of the assessment that China is the largest economy in the world – but this direct comparison of PPP-GDP as a measure of the wealth and standard of living is flawed in a financial context because the poorer you are and the lower your cost of living, the higher your PPP-GDP gets. The GPD assessment also contains the hidden flaw that China’s GDP derives not from consumption but from export oriented industrial production that makes goods for export to the West at lower cost than would be possible in the West. In terms of per capita consumption, China lags way behind the West with $3,224 per person in 2019 compared with $45,000 in the USA. The analysis provided above implies that significant social and structural differences make it impossible to make a direct comparison of gross national GDP and that therefore from the consumer’s point of view, China is not the richest country in the world.
(4) A similar error is found in a direct comparison of emissions. First, emissions in China are primarily industrial emissions and not consumer emissions. Second, much of these emissions come from two sources that have a direct link to the West. These are, (i) Western firms that have chosen to locate their factory in China, and (ii) Chinese factories that are making solar panels and wind turbines for the West. The ownership of these emissions must therefore have a more rational distribution than a single minded consideration of national boundaries. An implication of these complexities is that climate action emission accounting must be global because it cannot be understood on a country by country basis. This issue is discussed in a related post on this site: LINK: https://tambonthongchai.com/2020/05/22/climate-catch22/
(5) There is also a cultural issue in the emission confrontation between China and the West. Absolute literal truth no matter how ugly is a foundational principle of Western Civilization. Confucian philosophy contains the Li Principle. It affirms that manners are a primary means by which we express moral attitudes and carry out important moral goals. Confucian views on ritual extend this insight further by emphasizing the role that manners play in cultivating good character and in finding the conceptual boundaries of manners. What we call etiquette, social customs, and ritual Confucians see as expressions of Li , something we would understand as decorum. It expresses moral character and attitude. Li expresses the principle that good etiquette and good manners cultivate and express good intentions and good character. {SOURCE: Cline, E.M. The Boundaries of Manners: Ritual and Etiquette in Confucianism. Dao 15, 241–255 (2016). https://doi.org/10.1007/s11712-016-9490-1 (abbreviated and edited)}
(6) CONCLUSION: We propose in this post that the arguments presented in items (1) to (4) above imply that a confrontational attitude of the West with respect to China’s emissions contains serious weaknesses because the complexity of this issue is not taken into account. The Chinese response to Western demands for a greater climate action role of China is best understood in this light and in terms of the principle of Li in Confucianism.
An additional consideration is that a demand that China should live up to its commitments in the Paris Accord overlooks the weaknesses and inconsistencies in the details of what is called the “Paris Agreement” as discussed in a related issue on this site: LINK: https://tambonthongchai.com/2020/04/04/11245/
Here Xi Jinping has tried to calm the discourse with declarations of good intentions and expressions of good character that should probably be understood in terms of the Principle of Li in Confucianism. A bitter confrontation is not in either party’s interest because of the deep economic linkages described above. Yet, these expressions of Li may have been taken literally in the West. The communication is likely made difficult by cultural differences.

A SMALL SAMPLE OF THE LONG LIST OF WESTERN BUSINESSES THAT OPERATE THEIR FACTORIES IN CHINA
Abercrombe & Fitch, Abbott Laboratories, Acer Electronics, Adidas, AGI- American Gem Institute, Agrilink Foods, Inc., Allergan Laboratories, American Eagle Outfitters, American Standard, American Tourister, Ames Tools, Amphenol Corporation, Amway Corporation, Analog Devices, Inc., Apple Computer, Armani, Armour Meats, Ashland Chemical, Ashley Furniture, Audi Motors, AudioVox, AutoZone, Inc., Avon, Banana Republic, Bausch & Lomb, Inc., Baxter International, Bed, Bath & Beyond, Belkin Electronics, Best Foods, Big 5 Sporting Goods, Black & Decker, Body Shop, Borden Foods, Briggs & Stratton, Calrad Electric, Campbell ‘s Soup, Canon Electronics, Carole Cable, Casio Instrument, Caterpillar, Inc., CBC America, CCTV Outlet, Checker Auto, Cisco Systems, Chiquita Brands International, Claire’s Boutique, Cobra Electronics, Coby Electronics, Coca Cola Foods, Colgate-Palmolive, Colorado Spectrum, ConAgra Foods, Cooper Tire, Corning, Inc., Coleman Sporting Goods, Compaq, Crabtree & Evelyn, Cracker Barrel Stores, Craftsman Tools, Cummins, Inc., Dannon Foods, Dell Computer, Del Monte Foods, Dewalt Tools, Dial Corporation, Diebold, Inc., Dillard’s, Inc., Dodge-Phelps, Dole Foods, Dow-Corning, Eastman Kodak, EchoStar, Eclipse CCTV, Edge Electronics Group, Electric Vehicles USA, Inc., Eli Lilly Company, Emerson Electric, Enfamil, Estee Lauder, Eveready, Fisher Scientific, Ford Motors, Frito Lay, Furniture Brands International, Gateway Computer, GE General Electric, General Foods International, General Mills, General Motors, Gentek, Gerber Foods, Gillette Company, Goodrich Company, Goodyear Tire, Gucci, Haagen-Dazs, Harley Davidson, Hasbro Company, Heinz Foods, Hershey Foods, Hitachi, Hoffman-LaRoche, Holt’s Automotive Products, Hormel Foods, Home Depot, Honda Motor, Hoover Vacuum, HP Computer, Honda, Honeywell, Hubbell Inc., Huggies, Hunts-Wesson Foods, ICON Office Solutions, IBM, Ikea, Intel Corporation, J.M. Smucker Company, John Deere, Johnson Control, Johnson & Johnson, Johnstone Supply, JVC Electronics, KB Home, Keebler Foods, Kenwood Audio, Kimberly Clark, Knorr Foods, Kohler, Kohl’s Corporation, Kraft Foods, Kragen Auto, Land’s End, Lee Kum Kee Foods, Lexmark, LG Electronics, Lipton Foods, L.L. Bean, Inc., Logitech, Libby’s Foods, Linen & Things, Lipo Chemicals, Inc., Lowe’s Hardware, Lucent Technologies, Lufkin, Mars Candy, Martha Stewart Products, Mattel, McCormick Foods, McKesson Corporation, Megellan GPS, Memorex, Merck & Company, Mitsubishi Electronics, Mitsubishi Motors, Mobile Oil, Molex, Motorola, Motts Applesauce, Multifoods Corporation, Nabisco Foods, National Semiconductor, Nescafe, Nestles Foods, Nextar, Nike, Nikon, Nivea Cosmetics, Nokia Electronics, Northrop Grumman Corporation, NuSkin International, Nvidia Corporation, Office Depot, Olin Corporation, Old Navy,
Olympus Electronics, Orion-Knight Electronics, Pacific Sunwear, Inc., Pamper’s, Panasonic, Pan Pacific Electronics, Panvise, Papa Johns, Payless Shoesource, Pelco, Pentax Optics, Pep Boy’s, Pepsico International, Petco, Pfizer, Inc., Philips Electronics, Phillip Morris Companies, Pierre Cardin, Pillsbury Company, Pioneer Electronics, Pitney Bowes, Inc., Plantronics, PlaySchool Toys, Polaris Industries, Polaroid, Post Cereals, Pfister, Pringles,
Praxair, Proctor & Gamble, PSS World Medical, Pyle Audio, Qualcomm, Quest One, Ralph Loren, RCA, Reebok International, Reynolds Aluminum, Revlon, Rohm & Hass Company, Samsonite, Samsung, Sanyo, Shell Oil, Schwinn Bike, Sears-Craftsman, Sharp Electronics, Sherwin-Williams, Shure Electronics, Sony, Speco Technologies, Skechers Footwear, SmartHome, Smucker’s, Solar Power, Inc., Stanley Tools, Staple’s, Steelcase, Inc., STP Oil, Sunkist Growers, SunMaid Raisins, Sunkist, Switchcraft Electronics, SYSCO Foods, Sylvania Electric, 3-M, Tamron Optics, TDK, Tektronix, Inc, Texas Instruments, Timex, Timken Bearing, Tommy Hilfiger, Toro, Toshiba, Tower Automotive, Toyota, Toy’s R Us, Inc., Tripp-lite, Tupper Ware, Tyson Foods, Uniden Electronics, Valspar Corporation, Victoria ‘s Secret, Vizio Electronics,
Volkswagen, VTech, WD-40 Corporation, Weller Electric Company, Western Digital, Westinghouse Electric, Weyerhaeuser Company, Whirlpool, Wilson Sporting Goods, Wrigley, WW Grainger, Inc., Wyeth Laboratories, X-10, Xelite, Xerox, Yamaha, Yoplait Foods, Yum Brands, Zale Corporation.


THIS POST IS A FURTHER STUDY OF OUR OBSESSION WITH A COMING COLLAPSE OF CIVILIZATION PRESENTED IN RELATED POSTS:
LINK#1: https://tambonthongchai.com/2018/08/16/collapse/
LINK#2: https://tambonthongchai.com/2020/02/29/prophets-of-doom/
LINK#3: https://tambonthongchai.com/2019/04/16/theend/


OUR OBSESSION WITH THE COMING COLLAPSE OF HUMAN CIVILIZATION THAT PLAYS AN IMPORTANT ROLE IN ENVIRONMENTALISM IS SEEN IN THE POPULATION BOMB HYPOTHESIS AND THE CATASTROPHIC ANTHROPOGENIC GLOBAL WARMING HYPOTHESIS DESCRIBED IN RELATED POSTS ON THIS SITE.
THE OBSESSION IS BASED ON THE RISE AND FALL DYNAMICS OF CIVILIZATION SEEN THROUGHOUT HISTORY FROM THE NEOLITHIC REVOLUTION AT THE START OF THE HOLOCENE TO THE PRESENT. THIS POST IS A CRITICAL REVIEW OF THIS LINE OF THINKING.
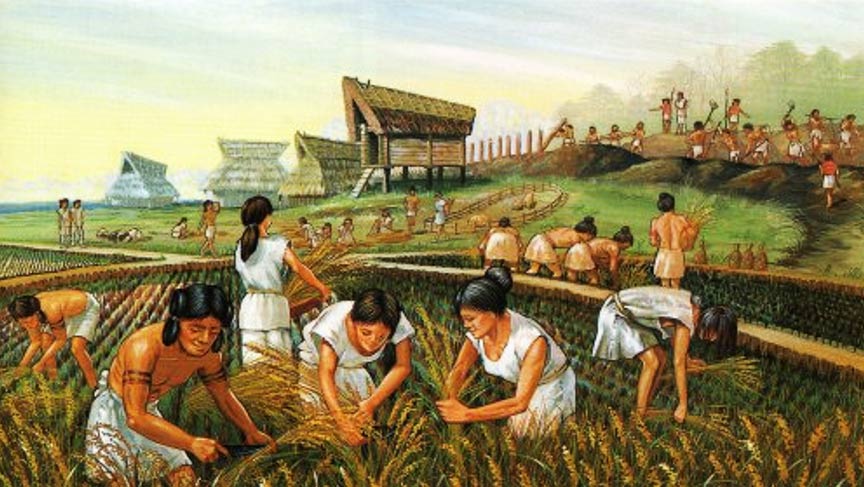

ABSTRACT: HERE WE USE A VOLATILITY MODEL FOR THE RISE AND FALL DYNAMICS OF CIVILIZATION AND PROPOSE THAT THE SPECTACULAR ADVANCE IN HUMAN WELFARE FROM THE NEOLITHIC REVOLUTION TO THE TECHNOLOGICAL ADVANCES OF THE INDUSTRIAL ECONOMY IS THE CREATION OF THIS VOLATILE PROCESS. THE HUMAN OBSESSION WITH FEAR OF A COLLAPSE OF CIVILIZATION IS INCONSISTENT WITH THE VOLATILITY MODEL WHERE THE HISTORY OF REPEATED RISE AND FALL OF CIVILIZATION IS SEEN NOT AS A ZERO SUM GAME BUT SIMPLY AS THE VOLATILITY IN THE PROCESS THAT CREATES LONG TERM GAINS. THE VOLATILITY MODEL IS CONSISTENT WITH THE RESILIENCE MODEL OF FAULSEIT AND INCONSISTENT WITH THE COMPLEXITY MODEL OF TAINTER BECAUSE THE SUBSEQUENT RESILIENT RISES OF CIVILIZATIONS CREATE GREATER AND GREATER COMPLEXITY AND ACHIEVE GREATER AND GREATER HUMAN WELFARE THEREBY.

JOSEPH TAINTER: ARCHAEOLOGIST, ANTHROPOLOGIST, HISTORIAN
PART-1: WHAT THE TAINTER BOOK SAYS
(1) Kando(2013): A summary of the Tainter Hypothesis by fellow blogger Professor Emeritus Tom Kando. LINK: https://european-americanblog.blogspot.com/2013/12/joseph-tainter-collapse-of-complex_10.html : (Edited and abbreviated). The consensus today is that it is possible to overcome the limits to increasing complexity of civilization through technological innovation but environmentalism disagrees. Tainter compares and contrast these two views of sustainability. Jared Diamond argues that staying the present course will result in collapse, due to scarcity of environmental resources. On the other side are the technological optimists, who reject Malthusianism and other doomsday scenarios where innovation is the key. As long as Research and Development are funded sufficiently, progress will continue. Tainter says that innovation is subject to the laws of complexity and the law of diminishing returns. This pattern is seen in Military and Medical research. It is a pattern of diminishing returns. Recently, Tainter analyzed five million patents to assess the long-term rate of productivity and innovation and found an increase in the size of patenting teams, an increase in research complexity, and a decline in per person productivity. Innovation productivity has also declined in bio-medical research, in energy, in solar and wind technology, in information technology and in nano-technology. The productivity of all scientific research is declining. According to Tainter, in the next 10 to 30 years (from 1988) American technological civilization will run into these traps: Funding the retirement of the baby boomers, The rise of health care costs, The decaying infrastructure, The environmental crisis, The energy crisis, High military costs, Increasing cost of technological and scientific innovation. The problem is cumulative complexity that undermines sustainability. Tainter says that the cumulative cost of complexity will destroys us but he does not advocate steady state because full employment for a growing population requires economic growth. Here are some comments from the audience after Tainter’s lecture: (1) Does Tainter know of societies which had survived the challenge of collapse caused by complexity? (2) Are there any societies which saw the light in time and survived? (Answer: The Byzantine Empire). (3): What about the sustainability of Australian aborigines, American Indians and other pre-industrial societies that are still with us today? Tom Kando (2013) concludes that “Tainter’s analysis is flawless. He is correct in calling for a conversation about our future, a conversation which we are NOT having“.

RELATED WORKS WITH REGARD TO Tainter, Joseph. The collapse of complex societies. Cambridge university press, 1988. BOOK.
(1) GREEN PLANET BLUES (2014): 27. BOOK REVIEW by Michael Bassey, Professor Emeritus Nottingham Trent University 2015: In 1972 The Limits to Growth report from the Club of Rome and reports of the UN Conference on the Human Environment held in Stockholm alerted many to the future dangers facing Planet Earth. The Book explains why documents like these caught the public imagination and conscience but today those concerned about climate change are frustrated. Global policies develop slowly in relation to the scale of problems. Although many political leaders around the world express concern about global warming and environmental degradation, the political will to take effective action is lacking. In the Global North, civil society has concentrated on climate change exclusively as an environmental issue and has focused on scientific and technical solutions such as emission controls and carbon credits. In the Global South, climate change has emerged primarily as a sustainable development issue, whose solutions are seen as inseparable from larger issues of poverty, trade and globalization. Consider what the development of plastics has done. The North Pacific Gyre is a dead zone and the Great Pacific Garbage Patch, where jellyfish ingest tiny plastic pellets in a floating graveyard of plastic at least twice the size of the US state of Texas. So what action should governments take? We need for international co-operation. Maybe the challenge of global environmental governance is to fill the ‘anarchic’ space of an ungoverned world system with laws and rules that can change environmentally destructive behaviour or maybe it is to reform or transform deeply imbedded political-economic practices that already govern the world system: trade, foreign investment, development assistance, multinational corporate activity. Bottom line, the challenge of achieving international co-operation is immense. Is this a task for the United Nations? The UN says climate change is real, and it is accelerating in a dangerous manner… It is a threat to international peace and security, yet deniers disagree. The UN Secretary-General says millions of people are in danger of going short of food and water. Climate refugees are re-shaping the human geography of the planet, a trend that will only increase as deserts advance, forests are felled and sea-levels rise. Mega-crises may well become the new norm. Free-trade politics have taken a heavy toll on the environment. The U.N. has documented growing problems with air, soil and water contamination, the result of urbanization and the modernization of agriculture. Sustainability and the UN’s SDG initiative is seen as a potentially effective response to global environmental problems. We must seek justice for the poor of the world. We need to “re-imagine” our unbalanced global economy with policies for the world’s poorest and reduce the damage done by consumer goods on vulnerable ecosystems. “Environmental degradation is everyone’s problem, but it’s especially a problem for the poor. Their position is precarious, so when things go wrong, whether it’s pollution or rising sea levels they are less able to respond. Inequality is a fundamental consideration in environmental policies. Awareness of the degradation of our planet and the need for urgent international action should be the top priority of us all. As Europe, the US and the emerging economies of Brazil, Russia, India, China, and South Africa continue to promote development models that rely on economic growth driven by over-consumption. How much longer can human society can continue on this path?


(2): THE RESILIENCE HYPOTHESIS OF RONALD FAULSEIT
Faulseit, Ronald K., ed. Beyond collapse: Archaeological perspectives on resilience, revitalization, and transformation in complex societies. SIU Press, 2016. RESEARCHGATE LINK: https://www.researchgate.net/publication/289378675_Beyond_Collapse_Archaeological_Perspectives_on_Resilience_Revitalization_and_Transformation_in_Complex_Societies
ABSTRACT: With regard to the Maya. The Romans. The great dynasties of ancient China, it is generally believed that these once mighty empires eventually crumbled and disappeared. A recent trend in archaeology, however, focusing on what happened during and after the decline of once powerful societies has found social resilience and transformation rather than collapse. In Beyond Collapse: Archaeological Perspectives on Resilience, Revitalization, and Transformation in Complex Societies, editor Ronald K. Faulseit gathers scholars with diverse theoretical perspectives to present innovative approaches to understanding the decline and reorganization of complex societies in the form of a collection of essays. Essays in the book are arranged into five sections. The first section addresses previous research on the subject of collapse and reorganization as well as recent and historic theoretical trends. In the second section, contributors look at collapse and resilience through the concepts of collective action, eventful archaeology, and resilience theory. The third section introduces critical analyses of the effectiveness of resilience theory as a heuristic tool for modeling the phenomena of collapse and resilience. In the fourth section, contributors examine long-term adaptive strategies employed by prehistoric societies to cope with stresses. Essays in the fifth section make connections to contemporary research on post-decline societies in a variety of time periods and geographic locations. Contributors consider collapse and reorganization not as unrelated phenomena but as integral components in the evolution of complex societies. Using archaeological data to interpret how ancient civilizations responded to various stresses—including environmental change, warfare, and the fragmentation of political institutions—contributors discuss not only what leads societies to collapse but also why some societies are resilient and others are not, as well as how societies reorganize after collapse. The implications of the fate of these societies for modern nations cannot be underestimated. Putting in context issues we face today, such as climate change, lack of social diversity, and the failure of modern states, Beyond Collapse is an essential volume for readers interested in human-environment interaction and in the collapse—and subsequent reorganization—of human societies.
Middleton, Guy D. “The show must go on: collapse, resilience, and transformation in 21st-century archaeology.” Reviews in Anthropology 46.2-3 (2017): 78-105. Collapse is a theme addressed by specialists from many disciplines, from environmental and sustainability studies to popular culture and the hard sciences, as well as by archaeologists and historians. This review focuses on three recent books about past collapses and sets them in the context of collapse studies. The new contributions build on the growing body of collapse theory and increasing data on individual case studies, but each takes a new direction, adding to the ongoing debates about collapse, resilience, and transformation. While taking us forward, it is apparent that issues of definition and terminology are still an issue in collapse studies. The review also demonstrates that collapse is an area of lively research that can be regarded as a recognizable subfield of archaeological and historical research that also crosses over into other disciplines. Footnote: My ideas on the recent developments in collapse studies were partly worked out in preparation for a lecture entitled “Understanding Collapse,” one of a series of lectures on collapse that I gave at Charles University, Prague (April 24–26, 2017).


CRITICAL COMMENTARY
(1) In a related post we interpret the repeated claims by climate activists, particularly Sir David Attenborough that the current global warming period of the Holocene will cause a Collapse of Civilization. LINK: https://tambonthongchai.com/2018/08/16/collapse/ , There we describe the Late Bronze Age collapse (LBAC) as a collapse of civilization caused by climate change and not complexity that had resulted in extended droughts at centennial time scales over a significant global extent. The collapse involved a large number of civilizations at different levels of complexity. The Archaeological data show that a long gap of more than a 200 years of a Dark Age followed the LBAC with no evidence of the great LBA civilization and global economy until the Early Iron Age-1 when an entirely new kind of global economy grew from the ashes of the LBAC. Although other theories of the LBAC have been proposed, the climate change theory predominates and is now the generally accepted theory of the LBAC.
(2) It is noted that significant uncertainties in the archaeological record and its radiocarbon dating facilitate a number of different theories of the LBAC to coexist although climate change is now the generally accepted theory. We also note in that post that religions prior to the LBAC do not contain a Judgement Day “end of the world” of any kind. However, religions that got started in the Early Iron Age right after the Dark Ages of the LBAC do contain a catastrophic end of the world of some kind as for example in Matthew 24 below.
MATTHEW24 IN REVELATIONS: Collapse of Civilization: When the disciples came up to Jesus to call his attention to its buildings. “Do you see all these things? Truly I tell you, not one stone here will be left on another; every one will be thrown down. Nation will rise against nation, and kingdom against kingdom. There will be famines and earthquakes in various places and then the end will come. Then let those who are in Judea flee to the mountains. Let no one on the housetop go down to take anything out of the house. Let no one in the field go back to get their cloak. How dreadful it will be in those days for pregnant women and nursing mothers! Pray that your flight will not take place in winter or on the Sabbath. For then there will be great distress, unequaled from the beginning of the world until now and never to be equaled again.Immediately after the distress of those days the sun will be darkened, and the moon will not give its light the stars will fall from the sky and the heavenly bodies will be shaken.
(3) It is likely that the existence of doomology in our time in the form of an obsession with collapse of civilization similar to the LBAC, but framed in terms of current events such as the industrial economy, climate change, population growth, or in Tainter’s complexity model, ultimately derive from a distant genetic memory of the LBAC. It may be that modern iron age humans carry a doomsday gene that creates the genetic memory of the LBAC and our inner forecast of our distant future therefore tends to be tainted and painted with this horrific memory of the collapse of civilization.
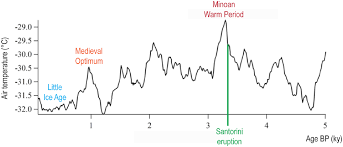
(4) In a related post {LINK: https://tambonthongchai.com/2020/10/04/james-burke-the-science-guy/ } science historian James Burke traces the history of human civilization through the Holocene from its inception in the Holocene Climate Optimum {LINK: https://tambonthongchai.com/2018/08/20/the-holocene-optimum-period-a-bibliography/ } through the cycles of warming and cooling of the Holocene {LINK: https://tambonthongchai.com/2019/06/11/chaoticholocene/ } to the current warm period to show that in the prior ten Holocene temperature cycles climate change determined human activity but that in the current warm period that causation has been reversed such that human activity causes climate change. In the presentation both the rise and the collapse of human civilizations in the Holocene are attributed to climate change and not to complexity.
(5) The two relevant features of the James Burke presentation described above are that (1) the collapse of civilization was caused by climate change and not by complexity and (2) through all those rise and fall of human civilizations, each subsequent civilization is greater with humans much better off than they were in the prior civilization. This means that in the rise and fall of human civilization seen in the history of the Holocene described by James Burke, each collapse of civilization leads to a greater civilization with greater complexity than the one that collapsed. In the overall trend across the eight or so civilization cycles we don’t see the flat stagnant cycle seen in textbooks (Chart#1) but a sequence in which the human condition goes through remarkable improvement and gains from one civilization cycle to the next (Chart#3).
(6) Using a stock market analogy, we show below a volatile market with no long term gains in CHART#2. This market represents the zero net gain rise and fall cycle of civilization subsumed in the Tainter and Ehrlich complexity model of the history of rise and the fall of civilization. However, this is not what has happened over the 8,000 years of Holocene civilization dynamics. There have been significant long term gains in human civilization over the full span of the Holocene. The corresponding stock market analogy is shown in CHART#3.
(7) CONCLUSION: In the volatility model, the rise and fall of civilization can be understood simply as the volatile mechanism in the long term advance of humans on earth. It is true that the volatility has been painful in the collapse leg of the cycle and the assumption is that we would be better off without the volatility. Yet, the resilience model implies a recovery that is stronger than the fall. Therefore, the volatility can be understood as the mechanism of our long term gains over the full span of the history of human civilization. We don’t start over from ground zero but from a resilience advantage described by Faulseit. CHART-1 AND CHART-2 BELOW SHOW THE ASSUMED VERSION OF THESE CYCLES BY TAINTER AND EHRLICH. CHART-3 SHOWS WHAT REALLY HAPPENED.

Faulseit, Ronald K., ed. Beyond collapse: Archaeological perspectives on resilience, revitalization, and transformation in complex societies.

CARBON FOOTPRINTS
Posted on: October 22, 2020
CLIMATE CHANGE
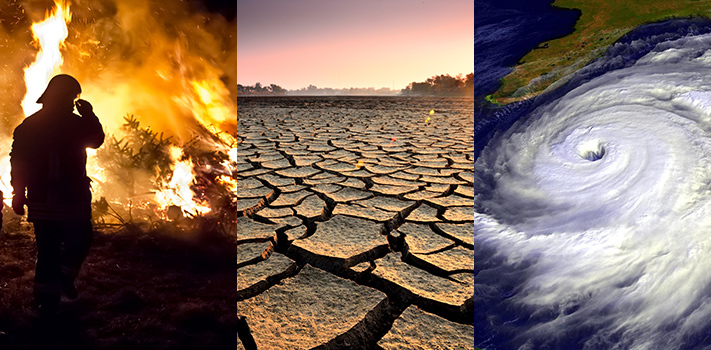
THIS POST IS A GRAPHICAL PRESENTATION OF CARBON FOOTPRINTS FOR SELECTED COUNTRIES IN METRIC TONS OF CO2 PER CAPITA
DATA PROVIDED BY THE WORLD BANK.

NEW ZEALAND: 7.8 TONS/PER CAPITA

CENTRAL AFRICA REPUBLIC: 0.1 TONS PER CAPITA


IRELAND: 8.1 TONS PER CAPITA

DEMOCRATIC REPUBLIC OF THE CONGO 0.1 TONS PER CAPITA

NORWAY 8.8 TONS PER CAPITA

SUDAN 0.4 TONS PER CAPITA
GERMANY 9.6 TONS PER CAPITA

BANGLADESH: 0.5 TONS PER CAPITA

UNITED STATES OF AMERICA: 16.3 TONS PER CAPITA
CAMBODIA: 0.6 TONS PER CAPITA
CONCLUSION
CLIMATE CHANGE IS A RICH MAN’S GAME: YOU HAVE TO GET RICH FIRST BEFORE YOU CAN WORRY ABOUT BEING RICH

CLIMATE CHANGE
